With the Eastern North Pacific, Central North Pacific and North Atlantic Hurricane seasons approaching quickly, now is a good time to brush up on the similarities and differences between graphic forecast “cones” from the National Hurricane Centre (NHC), Central Pacific Hurricane Centre (CPHC), Joint Typhoon Warning Centre (JTWC), and Japan Meteorological Agency (JMA) in their advisory graphics. As CPHC and NHC format are identical this post will only focus on NHC.
Let’s start off with the similarities shared by all 3 forecast “cones” shown in the graphics below by JTWC, JMA, and NHC respectively. Of note, the images below from JTWC and JMA show Typhoon Surigae information issued 22 April 2021. Firstly, the format by each agency in the graphical images holds true for all tropical cyclones. All 3 graphics show the expected track of the centre of a tropical cyclone with each forecast position being labelled with the respective date and time. All 3 forecast “cones” also show uncertainty in the forecast, however each agency differs in what the “cone” is actually representing which will be of key interest to mariners and discussed further below.
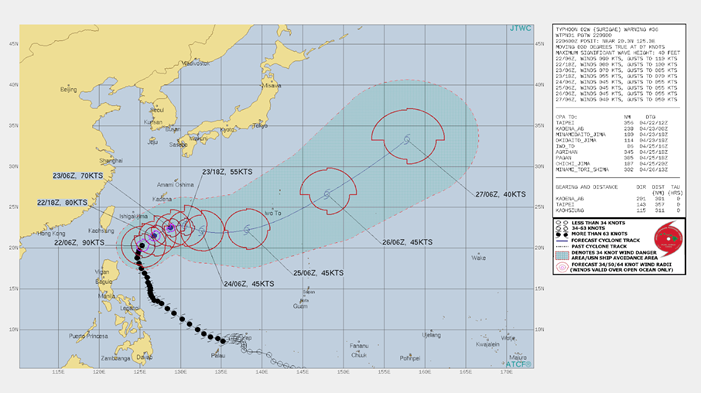
In the JTWC graphic, the forecast “cone” is represented by the red dotted line with enclosed shaded area. It is important to realize however that this area does not denote the forecast uncertainty in the track of the centre of a tropical cyclone, but rather the region that could experience gale force winds taking into account JTWC’s 5 year average historical forecast track error. For example, if looking at a +120hr forecasted position of a tropical cyclone, the forecasted position could be a lot different than the eventual observed position at that time. So, an entirely different area could be affected by the gale force winds than what was indicated in the original+120 hour forecast, which is why it is important to keep monitoring expected tracks of tropical cyclones and not assume one image/graphic is “safe.” All three centres issue updates every 6 hours.
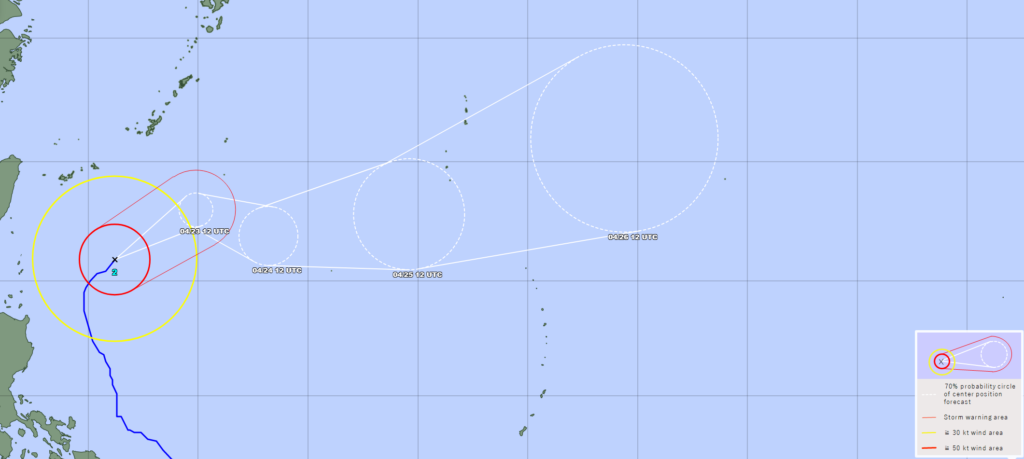
Both JMA and NHC forecast “cones” are constructed in a similar manner. They differ from JTWC in that the cone represents the uncertainty in track of the centre of a tropical cyclone (and not the potential gale force wind areas denoted by JTWC). The forecast “cones” in the JMA and NHC graphics are formed by connected circles, where each circle represents uncertainty in the forecast at each forecast time. The JMA and NHC “cones” get larger farther out in time due to increasing uncertainty. It is also important to realize for both JMA and NHC “cones” that gale force winds could extend out well beyond the cone (especially early on in the forecast when uncertainty is lower and the cone is small). As such, JMA show the 30Kt (yellow) and 50Kt (red) wind areas where as NHC show the current extent for winds greater than 34Kt (orange circle) and 64Kt (brown circle).
For JMA cones, a tropical cyclone is expected to remain within each of these circles 70% of the time, with a 30% chance that it will track outside each circle. The circle radius is determined by a combination of multiple ensemble model forecasts (large differences among ensemble members results in a larger circle and vice versa).
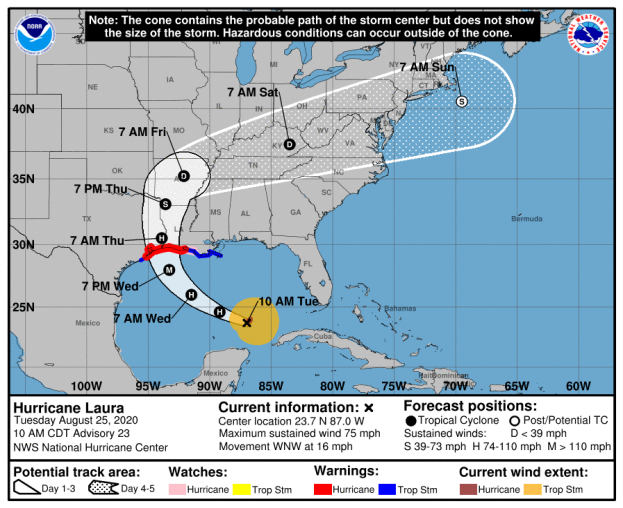
Lastly, NHC construct their cone by drawing a circle at each forecast position so that 2/3rds of the previous 5 years forecast track errors fall within the circle. All the circles are then connected to form the cone. Also of note is that the entire forecasted track of a tropical cyclone is expected to remain within this cone 60-70% of the time, meaning the track could fall outside of the cone 30-40% of the time. Additionally, it should be noted that the above percentages do not take into account how fast a tropical system is moving. For example, a system could be moving much slower or faster than forecasted with a large forecast error, but still fall within the NHC cone. Lastly, NHC forecasted positions will be labelled in local time, rather than GMT/Zulu time like JTWC and JMA.
You might be wondering how one can visualize probability of gales for NHC advisories, stay tuned for a post in a couple weeks about how to do just that.
Meantime, stay connected and safe.