

A typical Suezmax voyage from the US Gulf to Northwest Europe carries about a million barrels of crude. The charter party warrants speed and consumption in good weather, and the charterer is expecting an arrival date. Five days into the passage, the forecast shows a low-pressure system deepening across the planned track.
The great circle is still the shortest route. Whether it is still the fastest depends on the forecast: how strong the system becomes, where it tracks, and what the sea state will be when the vessel gets there. The operations team has hours, not days, to make the call.
Where the forecast meets the ship
The first challenge is time. A voyage of two weeks or more outlasts the window in which forecasts are most reliable, so a route chosen at departure rests partly on conditions that can’t yet be forecast with confidence. That is why routing combines the latest forecast with climatology, the typical conditions for that area and season. As forecasts update, and as models disagree on how a system will develop, the best route can change. A decision that made sense on day one may not hold on day five.
The second is the ship itself. A laden Suezmax sits deep, with little freeboard, and loses speed quickly in head seas and heavy swell. That leaves two costly options: burn more fuel to hold schedule, or slow down and lose time. Often, a longer route through calmer water arrives first.
The third is geography. The main Suezmax trades cross some of the world’s most demanding waters: winter storms in the North Atlantic, rough approaches through the Bay of Biscay and, on voyages via the Cape of Good Hope, steep seas where swell meets the Agulhas Current.
Every hour also has a price. Owners carry the cost of extra bunkers and extra days at sea. With the EU ETS now fully phased in, extra fuel burned on EU-linked voyages also means extra carbon allowances. When a charterer questions speed or consumption, the outcome often comes down to two questions: what was the weather really like, and can the owner prove it?
Access to weather data isn’t the problem. Forecasts are everywhere. The challenge is turning an uncertain forecast into a routing decision that can be justified, for each vessel and for the whole voyage.
What better forecasting and weather routing looks like
Good forecasting and weather routing isn’t a single recommendation made before departure. It’s vessel-specific advice at the planning stage, followed by continuous oversight until arrival, with the reasoning recorded along the way.
That’s how FleetWeather works. Our Weather Routing & Forecasting service gives each vessel tailored forecasts and routing advice before and during the voyage, with 24/7 oversight from RMetS-accredited marine meteorologists. When conditions change, the route changes with them, and the vessel and shore teams know why.
The results for Suezmax tankers speak for themselves. Across Suezmax voyages routed by FleetWeather since 1 September 2025, the average voyage saved:
| Average saving per voyage | |
| Time | 6.3 hours |
| Cost | $50,537 |
| Fuel | 10.4 mt |
| Emissions | 33.2 mt CO₂ |
In practice:
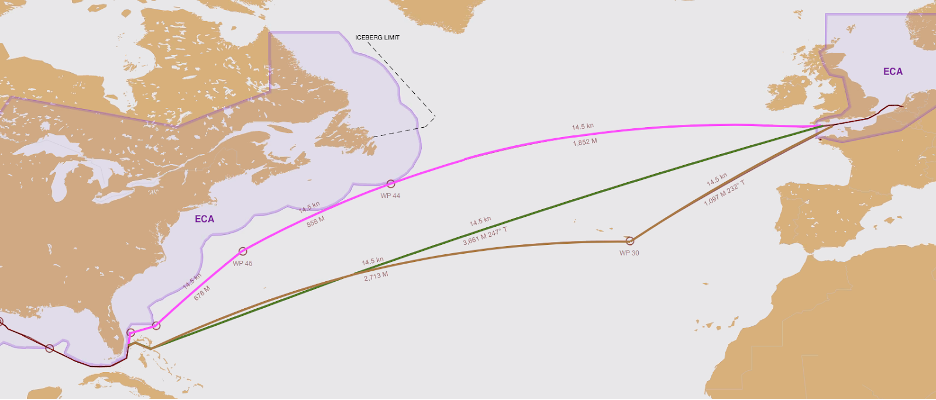
| Masters Route | Alternative Route | Recommended Route | |
| Total Miles (nm) | 4999 | 5174 | 5307 |
| Total Miles through Water (nm) | 5992 | 5749 | 5613 |
| Speed Achieved (kts) | 8.09 | 8.96 | 9.42 |
| Total Voyage Time (hrs) | 617.9 | 577.6 | 563.6 |
In September 2025, a Suezmax tanker shared its intended route from Corpus Christi, US, to Karachi, Pakistan. FleetWeather recommended an alternative route that made better use of currents, in particular by avoiding long exposure to strong adverse currents off northeastern Brazil. The Master followed the recommendation. Estimated savings: 17.4 steaming hours, more than 24 mt of fuel, 78 mt of CO₂ emissions and over $135,000.
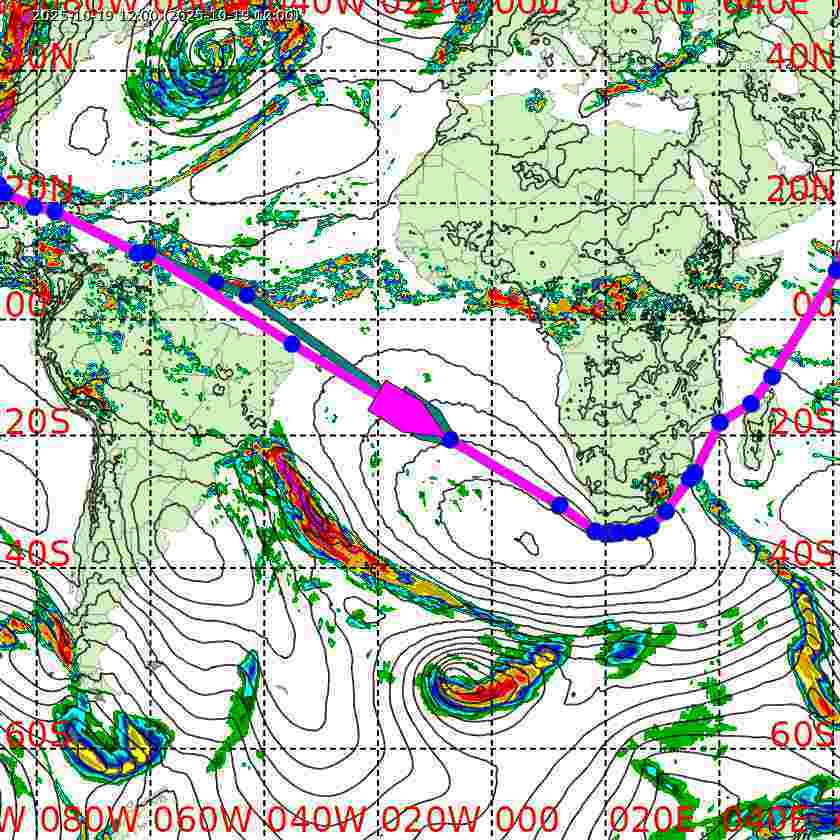
Route Performance Comparison
| Master’s Route | FleetWeather Route | |
| Distance Over Ground (nm) | 12,320 nm | 12,341 nm |
| Total Voyage Time (hrs) | 1,090.8 | 1,073.4 |
| Speed Made Good (kts) | 11.29 | 11.5 |
Estimated Savings on FleetWeather Route vs. Master’s Route
| Time Saved 17.4 Steaming Hours | Fuel Saved More than 24 mt | CO2 Emissions Saved 78 mt | Cost Savings Over $135,000 |
Forecasting and routing also connect to what happens after the voyage. With FleetWeather’s CPC / Claims Defence service, the same weather and performance data becomes structured evidence for charter-party discussions and claims, so owners aren’t starting from scratch when a dispute comes up.
The cost of standing still
Sticking with the shortest route by default has a cost that doesn’t show up on a single invoice. It builds up voyage by voyage: hours lost in heavy weather, fuel burned holding schedule, emissions that have to be reported, and performance claims that are harder to defend.
Across a Suezmax fleet, an average of $50,537 per voyage is a real difference to the bottom line. The question for operators isn’t whether weather affects their voyages. It’s whether they’re making routing decisions with the right expertise behind them.