Overview
One of the most valuable elements a ship routing service can offer to ship operators is an accurate route recommendation and comparison which can result in significant savings. Savings can be measured by a number of metrics, most notably money, bunkers consumed, and emissions. As part of Fleetweather’s weather routing services, we provide clients with a Prevoyage Brief (PVB) which takes into account forecasted conditions (wind, seas, and currents) and includes a statistical table and visual graphics illustrating the optimal route for a voyage. The PVB highlights the forecasted savings in distance through water and steaming time that can be achieved by following Fleetweather’s recommendation over the shortest route or compared to a Master’s intentions. Factoring in fuel and hire rates, as well as vessels’ consumption rates and emission factors, the data from our PVBs can be used to generate estimated savings across a voyage or fleet over any period of time.
This blog features a case study on two small fleets of Suezmax Tankers in the Atlantic and Pacific Oceans and demonstrates the 2022 year-to-date savings produced by Fleetweather’s PVBs (Figure 1). Across these two fleets to date, we estimate we have saved over $532,000 in fuel and hire costs and nearly 900MT of emissions. For reference, a gasoline-powered car could drive to the moon and back five times before emitting the same amount!1

We break down the voyages into those where route optimisation was possible (compared to the shortest or Master’s route) and show in Figure 2 the average savings accomplished per voyage in the case study:

For this study, we will examine how savings have varied for this vessel type across different seasons and weather patterns this year, what types of routes are generating the most savings, and compare route savings across different ocean basins.
Seasons
Weather patterns and currents are constantly changing; however, most mariners are aware that wintertime generally brings more frequent adverse weather conditions equatorward towards busier shipping lanes. For this reason, the shortest route often needs to be adjusted in order to minimise the effects of migratory storm systems across the Atlantic and Pacific Oceans. As we transition into spring and summer in the Northern Hemisphere, more direct routes can often be safely utilised by vessels transiting across the northern Atlantic and Pacific. You may expect most savings to be generated during the winter months; however, this study also exhibits savings in the spring and moving into summer (Figures 3 and 4).
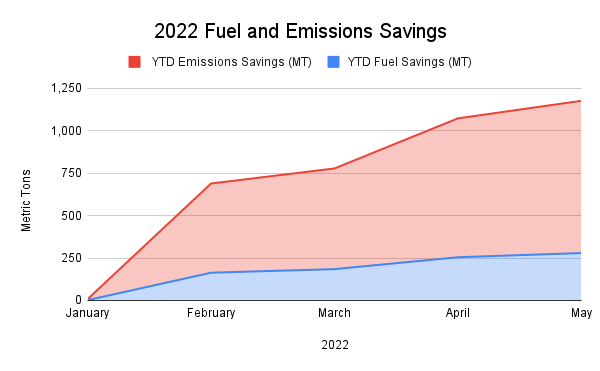

Figure 4 reveals over 6.6% average savings for the month of February (Northern Hemisphere winter), and nearly 6% average savings for the month of May (Northern Hemisphere spring). In the next section, we will investigate a specific voyage in February that demonstrated appreciable savings.
Voyage Example
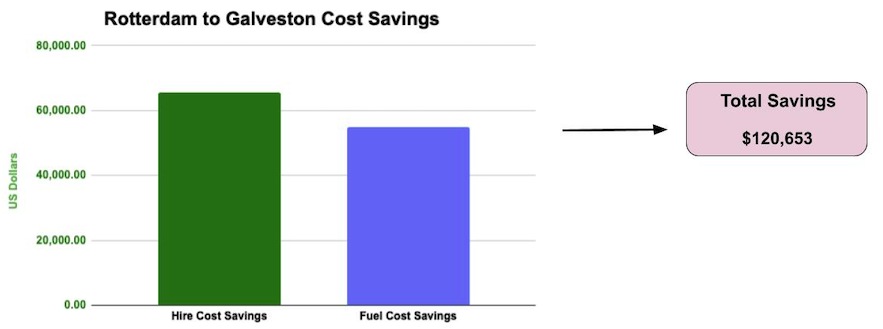
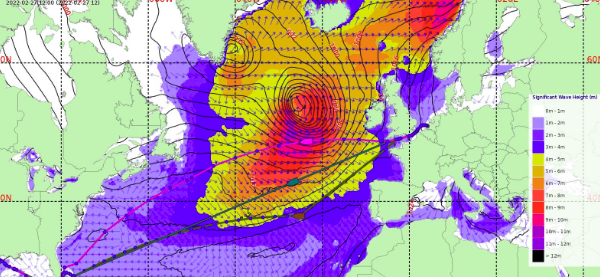
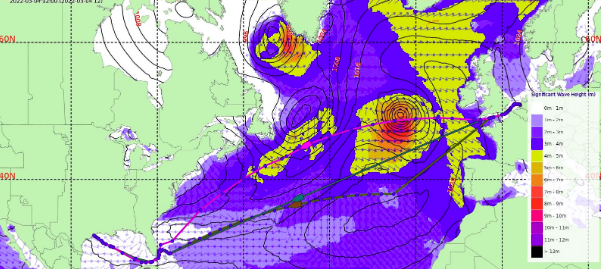
One Suezmax Tanker embarked on a voyage from Rotterdam to Galveston in mid-February. At the time of the voyage, an active winter gale/storm track was in place over the northern Atlantic. The Master came in with intentions to take a direct GC route from the English Channel to Florida Straits. While this route was the shortest option, it also exposed the vessel to persistent adverse weather conditions and adverse Gulf Stream currents. Fleetweather analyzed the forecasted conditions and provided a couple of alternate routing options. In the end, Fleetweather’s recommended route (via south of the Azores) provided over 9% savings as compared to the Master’s intentions, equating to over $120,000!
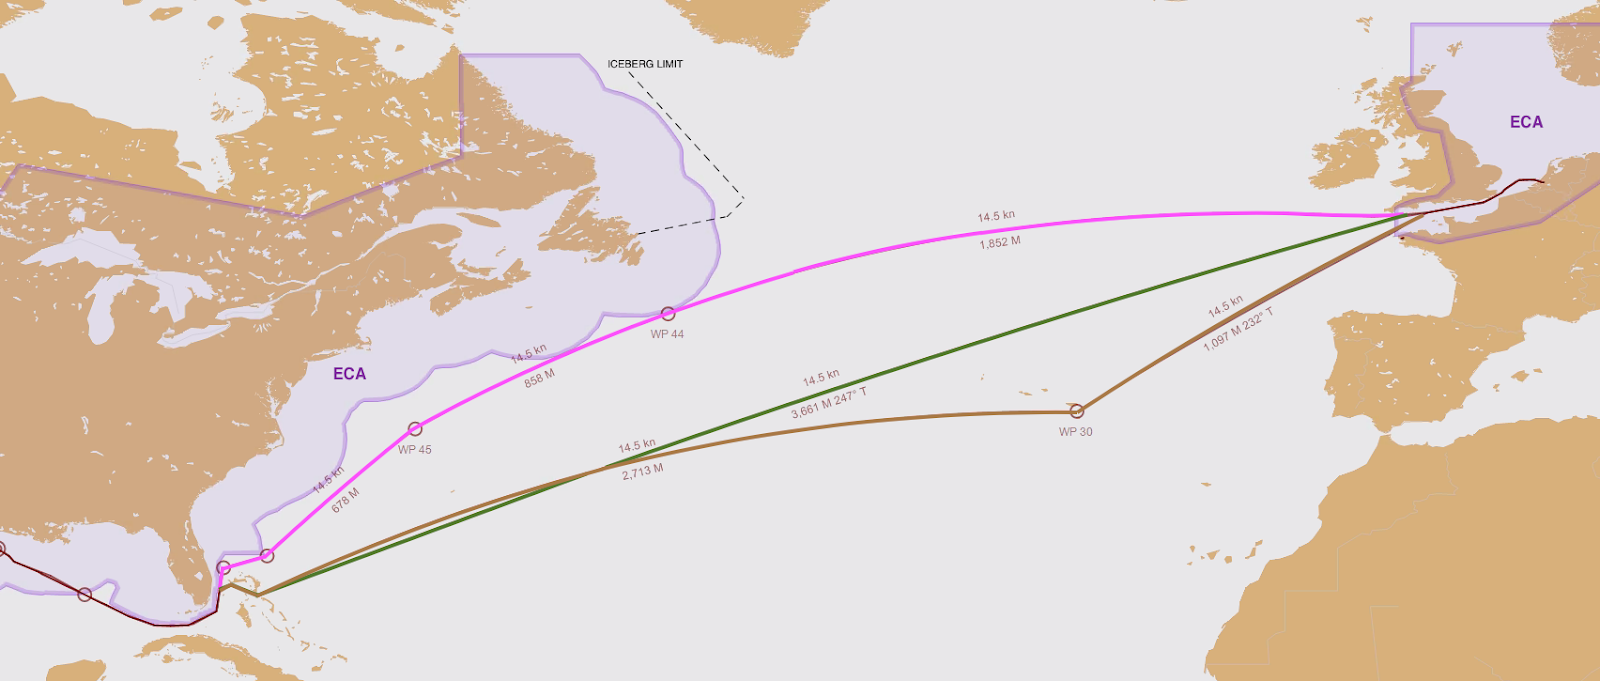
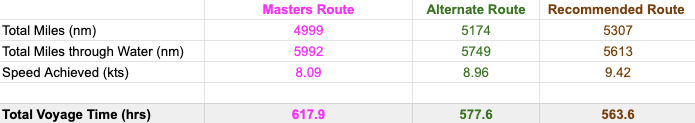
Given the time of year and active weather pattern it was evident that the shortest route was not the safest and also not the most optimal. A late winter active gale/storm track was in place from the Canadian Maritimes, east-northeastward to the British Isles. A series of storms was to bring several rounds of heavy weather and very rough seas, reaching the Azores during the vessel’s transit. The northern Great Circle route would have exposed the vessel to storm force conditions and significant wave heights up to or exceeding 10meters. A more conservative route south of the Azores minimised the heavy weather, as well as allowed for a shorter transit time.
Route Type
Generally speaking, higher savings are attainable on cross-ocean transits than coastal routes, as cross-ocean voyages are typically longer and exposed to a wider range of weather conditions en route as compared to coastal voyages. However, as discussed in one of Fleetweather’s previous blogs (Ship routing – Is it worth the expense?) considerable savings can be gained on coastal routes as well, often by taking advantage of helping currents and avoiding adverse currents. Figure 9 shows the average percent savings by route type for this case study. While approximately double savings are achieved on cross-ocean routes compared to coastal, you will still note nearly 2% savings on coastal routes alone.

Ocean Basin
The fleets examined in this study were located in the Atlantic and Pacific Oceans. The Atlantic voyages resulted in nearly 4% average savings, while the Pacific voyages showed nearly 3% (Figure 10). Fleetweather routes vessels across the globe, and similar savings can be illustrated in each ocean basin.

Conclusion
A key feature of Fleetweather’s weather routing service is optimal routing via pre-voyage planning. As part of this service, Fleetweather can track cumulative savings (time, distance, fuel, emissions) for a single voyage and at the vessel or fleet level for clients. The savings that can be accrued by clients as a result of the PVB far outweigh the cost of the service by many orders of magnitude. Additionally, the reduction of harmful emissions and fuel consumptions as a consequence of the PVB contribute to a cleaner environment as the maritime industry pushes towards greater sustainability.
This particular case study isolated a couple of small fleets of Suezmax Tankers and displayed the level of savings that can be gained across different ocean basins in changing weather patterns. Stay tuned for more articles detailing route savings on all types of vessels across the globe.
Stay Connected and Safe.
References
- United States Environmental Protection Agency Greenhouse Gas Equivalencies Calculator