Monitoring potential changes in upper air patterns is extremely important as this provides longer lead times for ship route planning purposes. The Polar Vortex (PV) is no exception, and while many associate this with cold air and freezing conditions, a PV event plays a significant role in altering weather patterns at sea. It is an important parameter that Fleetweather monitors during Winter and here is why.
Stratospheric and Tropospheric Polar Vorticity
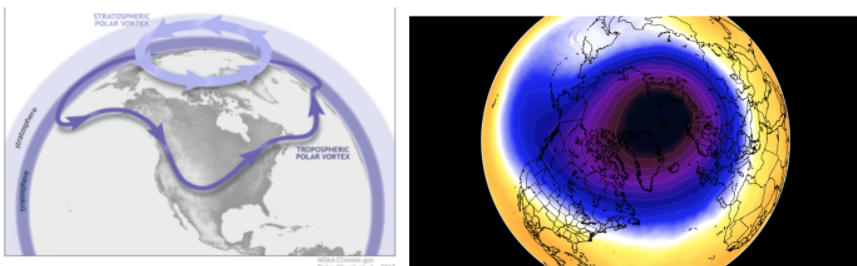
Figure 1: Illustration of Left: Comparison of Stratospheric and Tropospheric PVs, with arrows indicating the direction of atmospheric flow. Right: Typical Stratospheric Polar Vortex – symmetrical and centred over the pole. Sources: Left: NOAA. Right: Severe Weather EU
The term ‘Polar Vortex’ (PV) is commonly used to describe two distinct phenomena as illustrated in Figure 1:
- The Stratospheric PV is an area of high-speed, west to east rotating winds around 7-31 miles high, poleward of 50°, that is also known as the Polar Night Jet because it only appears during the dark polar winter. It is characterized by freezing temperatures of up to -80° Celsius and breaks down in Spring as the polar night ends. It forms the boundary between the very cold Arctic air and the warmer air over the mid-latitudes however, it can also become unstable and break down for periods (see later).
- The Tropospheric PV is a year-round feature associated with mid-latitude weather, driven by the temperature difference between the Arctic/Antarctic and the mid-latitudes, and is defined as the area poleward of the tropospheric jet stream. It extends from the surface up to around 5-8 miles high and its boundary winds are more commonly known as the jet stream. The strongest jet stream is known as the Polar Jet Stream which also rotates west to east. It exists all year, but is weaker in the Summer and strongest during the Winter when the polar regions are coldest. It is much larger than the stratospheric PV and the position and strength of the jet stream have a big impact on mid-latitude weather.
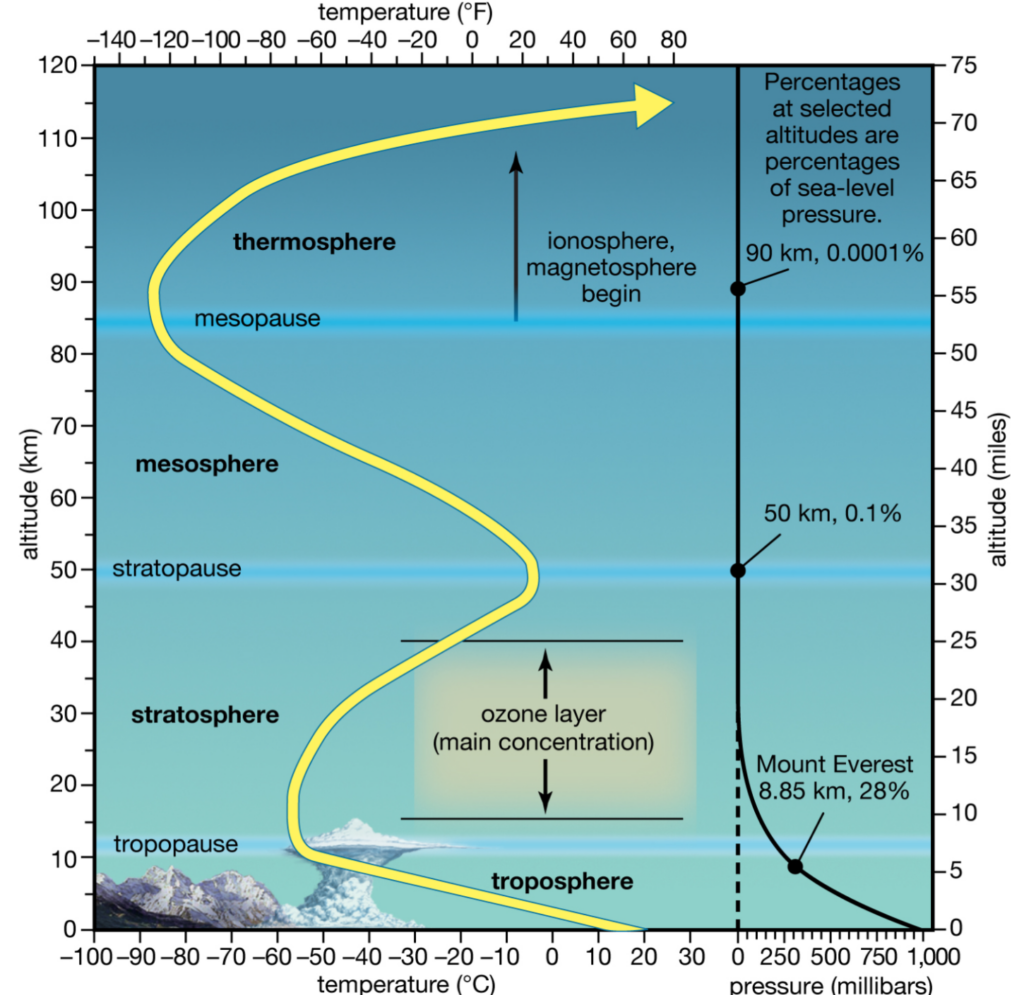
Figure 2. Earth’s Atmosphere and Temperature Profile. Source: Encyclopaedia Britannica.
Top Down Influence
So, how can events occurring 7-31 miles above the earth’s surface impact a vessel sailing at sea level? All levels of the atmosphere are interconnected as illustrated in Figure 2 and extreme events in the stratosphere can have substantial impacts on surface weather, through coupling between the stratospheric PV and the tropospheric jet stream. In particular, any warming of the temperature profile in the stratosphere creates instability which can lead to significant changes within the troposphere (the layer of the atmosphere where weather occurs).
Typically, this can be caused by large weather patterns in the troposphere which force energy upward disrupting the stratospheric PV. In many cases, the precursor to this event occurring is known as a ‘Sudden Stratospheric Warming (SSW)’ in which the polar stratospheric temperature rises (by as much as 40-50 deg C) over the course of a few days. This disruption can cause the circulation to slow down, reverse in direction or even split into two separate vortices spilling cold air down towards the surface and into the mid-latitudes. This can then also cause the troposphere winds to reverse direction in a time frame stretching from a few days to weeks.
Of note, SSW events are not unusual but recent evidence shows they are close to occurring annually, if not more frequently, linked to global warming, especially as the Arctic region warms disproportionately compared to the tropics – a phenomenon known as Arctic amplification. Essentially, this warming is generating more energy which when it strikes the PV makes it more likely to disrupt it.
We currently have a SSW event ongoing over the coming weeks, with highest anomalies currently over Siberia to the Gulf of Alaska, and a secondary anomaly over Scandinavia. This is causing anomalously colder temperatures southeastward across a majority of the Atlantic Ocean Basin, as can be seen in the image below:

Figure 3: Stratospheric temperature anomalies for 27th November, courtesy of WeatherBell. Notice temperatures 17-19C above normal above the Siberia to Gulf of Alaska region.
Subsequent changes in the troposphere and at the surface lag by up to several weeks following changes in the Stratosphere, so we can expect a likely ridge of high pressure across the Western Pacific, and a trough across Alaska/Northwest North America to develop, which is exactly what can be seen in Figure 4:

Figure 4: 500mb height and anomaly chart for next 10 days (17th thru 27th November) courtesy of WeatherBell. Note the strong ridge of high pressure (near Omega Block) across Eastern Russia, and the strong trough across Alaska and NW Canada extending southwestward across the North Pacific to Japan.
This also translates down to the surface to create a very active pattern across the North Pacific Ocean during the last 2 weeks of November as depicted in Figure 5, with a series of winter storms lining up to cross the ocean, some of which may reach hurricane strength.

Figure 5: Satellite image detailing the active pattern across the Pacific Ocean Basin, with 5 distinct low pressure systems along the Polar Jet Stream, and 2 low pressure systems further South along the subtropical jet (denoted by L symbols). Source Fleetweather.
A PV collapse is just as dynamic as it sounds, pushing cold air out of the polar regions, into temperate latitudes, and heavily disrupting normal winter weather patterns. So how does all of this pertain to ocean routing and the services offered by Fleetweather?
- Analysing the pattern at the upper reaches of our atmosphere can help forecasters look for potential weather pattern changes at the surface thereby increasing lead time on optimizing vessel routing. Typically, there is a lag of 1-2 weeks following A SSW event.
- A breakdown in the PV will generally lead to more meridional flow with amplified troughs and ridges. This means more Equator to Pole (and vice versa) air flow, indicative of the poleward transport of heat, and equatorward transport of cold air. What this means for the mariner is that more typical wintertime zonal flow (west to east) of fast moving depressions is replaced by slower moving and stronger storm systems, with a greater potential for cut-off low pressure systems to form that develop a fully arisen sea. This increases the need for accurate route optimization, due to the increased chances of heavier weather (sustained stronger winds and rougher seas) typical of such a pattern.
- Surges of cold air at the surface can lead to enhanced potential for freezing spray and ship icing, typically in the Yellow/Bohai Seas, off Eastern Japan and the Kuril Islands, off the east coast of Canada and northeast USA, Great Lakes and the Baltic Sea. Fleetweather can alert vessels of freezing spray potential, allowing preparations in advance or avoidance of those areas.
- Steam fog (also known as “sea smoke”) events occur most often over polar regions, as they require very cold dry air. However, the potential exists for this phenomena anytime a very strong outbreak results in very cold dry air moving over much warmer water. This is usually a very shallow layer of fog close to the ocean surface, which can greatly impact mariners in coastal waters or near ice edges/ice bergs etc.
Since Arctic warming may be contributing to more than usual disruptive winter weather patterns, Fleetweather continuously monitors data from all levels of the atmosphere to maximise lead times to potential pattern changes which can impact the vessels under our service.
Stay connected and safe.