The Podium5 voyage informatics platform accommodates multiple data sources and uses them to promote safety, efficiency and sustainability. This latest blog details another real life example of anomaly detection and resolution within the platform.
Whilst the scope of data collection, transmission and end point application is expected to increasingly standardised in the future, today there is considerable complexity. Data collection may be almost entirely manual or entirely from sensors and all points in between. Data transmission can occur at intervals ranging from days to minutes or seconds. End point applications are multiplying as regulations and voyage stakeholder demands increase. Accommodating these different factors and obtaining a consistently accurate performance picture in this environment is challenging to say the least.
Challenging does not mean impossible and applying some seafaring skills to data helps. There is a long standing rule of navigation which says a single reference should never be relied on entirely and should always be cross checked and validated. This rule can be applied within Podium5 as we show below. Fuel use is often the focus of Views in the platform. Here we have a single Card containing two metrics; main engine load and fuel consumption.
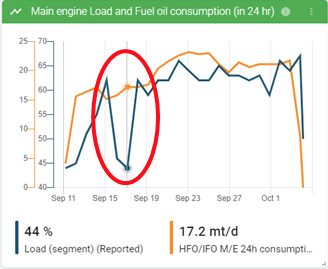
Generally, the higher the load, the more fuel the engine will consume. An anomaly has been detected in the relationship between the two metrics and an alert has been generated when the reported load dropped from 60% to 45% without a corresponding drop in fuel consumption. In isolation the reason for the anomaly is not clear and either input could be in error. Cross referencing and validation are required and in this case the output from a shaft power sensor Card is added to the View.
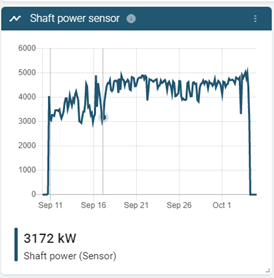
The shaft power sensor data correlates with the fuel consumption, suggesting the engine load data is in error. Variations in the shaft power readings indicate there may be other factors. To provide additional context Podium5‘s environmental factors Card, with data from FleetWeather is added.
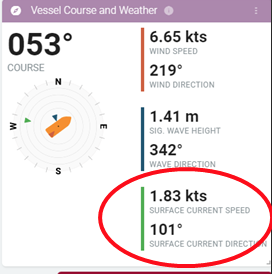
The addition of this Card shows a significant positive current influence of 1.83 knots at the time when the engine load was reduced. The anomaly has now been fully explored and explained by connecting and cross referencing different data sets within the Podium5 View.
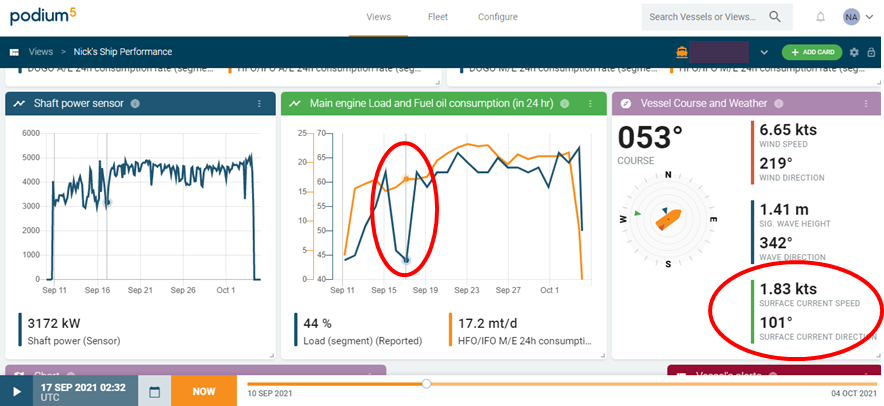
We look forward to bringing you more examples of the benefits of voyage informatics. This is the value of connecting data to understand the big picture.
Stay connected and safe.