When an iceberg passes into the shipping lanes, it becomes an issue of navigation and ship safety. Offshore of Newfoundland and south of Greenland, the Canadian Ice Service and US Coast Guard North American Ice Service provides information on ice conditions regarding icebergs and sea ice. Most icebergs will enter the North Atlantic shipping lanes in the spring and early summer. Of note, 2020 was a noticeably below average year for icebergs off Newfoundland and south of Greenland (see Figure 1) but it looks like 2021 will set new records in terms of reduced iceberg presence. If this continues then there are opportunities for shipping to exploit this.

Figure 1 – 2020 Iceberg Concentration South of 48N by Month (US Coast Guard International Ice patrol)
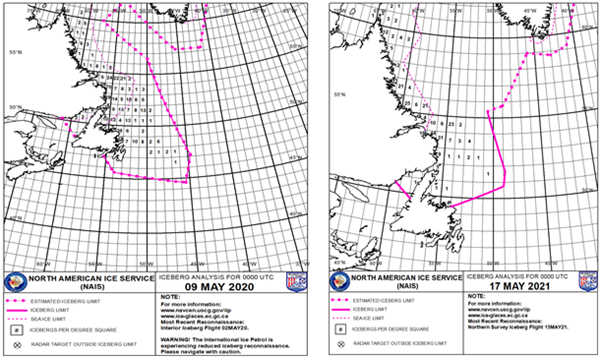
Between 1900 and 2019, the average number of icebergs during April was 130 and during May was 155. In 2020 however, there were only 33 and 76 icebergs observed south of 48N for April and May respectively. In May 2020 (Figure 2), according to the North American Ice Service, the estimated iceberg limit extended down to ~ 44N/45W. The concentration of icebergs per degree square however, was most noticeable in areas north of 48N and west of 50W.

Figure 2 – Iceberg/Sea Limit 9 May 20 (Left) and 17 May 21 (Right) (US Coast Guard NAIS)
For 17th May 2021 the estimated iceberg limit is pushed back much further north than in 2020 and the southern limit is primarily above 50N. While the estimated iceberg limit to the south of Greenland is about the same as 2020, the concentration of icebergs between Greenland and Newfoundland has noticeably decreased.
Global warming aside, this variability in iceberg coverage is thought to be linked to an irregular fluctuation of atmospheric pressure over the North Atlantic which has two prevailing modes: a “positive mode” where a strong subtropical high is located over the Azores and low pressure is centred over Iceland, and a “negative mode” in which weaker high- and low-pressure systems occur over the same locations, as depicted in Figure 3.

Figure 3. Typical path of the polar jet stream during negative (Left) and positive (Right) modes of the North Atlantic Oscillation (NAO), from Encyclopaedia Britannica, Inc
If a negative NAO is present, the extent of iceberg coverage tends to decrease and be more confined to the coastline of Newfoundland. There are a couple of reasons for this. During a negative NAO, local ocean currents, such as the cold Labrador current, tend to become disrupted and weaker. This results in pushing icebergs north and west instead of south. The prevailing winds also aid in preventing icebergs as well as sea ice from migrating south of 48N. Also, high pressure over Greenland creates southerly flow at the surface bringing in warmer air temperatures and sea surface temperatures. With disruption of normal ocean currents and prevailing winds, the setup is usually not favourable to push icebergs that far south. So a negative NAO would favour icebergs to remain confined to the coast rather than the open ocean. For the rest of May, most climate models indicate that a negative NAO will continue to occur (Figure 4).

Figure 4 – Observed and Predicted NAO Forecast from NOAA (Source)
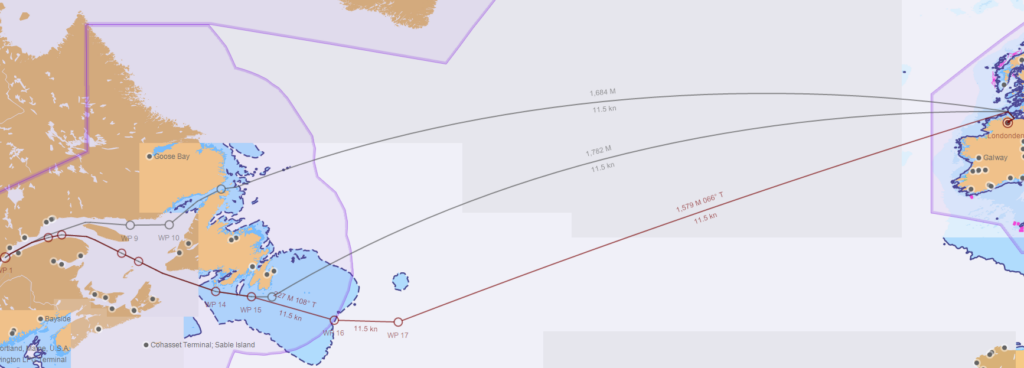
Given the predicted trend of a negative NAO through at least mid-May, icebergs are not expected to migrate too far south. This could have a noticeable impact on the shipping lanes around Newfoundland and Greenland. One key impact that a negative NAO might have on the shipping lanes is vessels being able or willing to transit through areas previously avoided during this time of year. An example of this would be making use of the Strait of Belle Isle between the Labrador Sea and the Gulf of St. Lawrence. As iceberg concentration is also well below average for May 2021, it might be possible for vessels to transit through Belle Isle Strait more frequently and earlier than normal. Figure 5 shows the options for routing depending on the extent of iceberg coverage.

Figure 5 – Chart showing most direct routing from Montreal to Londonderry, with and without utilizing Strait of Belle Isle and for an above average ice year via 45N 45W.
If this trend in reduced iceberg extent continues then the Strait of Belle Isle could become a more frequent routing option in May/June depending on the season. The table 1 below summarises the corresponding differences in distance for a notional cross Atlantic voyage between pilot stations.
| Montreal to Londonderry (GC) via St of Belle Isle St | 2334nm | Shortest |
| Montreal to Londonderry (GC) in below average ice year | 2534nm | +200nm |
| Montreal to Londonderry (RL) in above average ice year via 45N 45W | 2676nm | +342nm |
Table 1. Illustrative route options and associated distances depending on ice extent for May (GC: Great Circle, RL: Rhumb Line).
Stay connected and safe.