Climatology is not sexy. If it were a vehicle it would be a van not a sports car. However, it has always been absolutely key to ship routeing and this is an area where what is “under the hood” really matters. Climatology is defined as “weather conditions averaged over a period of time”. Prior to Numerical Weather Prediction and modern weather forecasting, ship routeing was performed based on experience, pilotage notes /guides and knowledge of the prevailing conditions i.e. climatology. This is evident in the seasonal routes taken by sailing vessels driven by large scale events such as the trade winds and monsoons. Pilot charts and sailing instructions continue to include information regarding the prevailing winds and currents during each season.
Today many vessels and shipping companies use route optimisation software or services provided by specialists to inform voyage planning. Numerical Weather Predictions (including wave and current models) produced by the European Centre for for Medium Range Weather Forecasts (ECWMF) and others underpin the conduct of route planning and optimisation. The full set of information required is only available for 7 days ahead and many voyages are considerably longer than this. Beyond 7 days the router or the software can either assume that nothing changes and that the last weather experienced will persist, this is known as ‘persistence’, or default to climatology.
This latter case is where the quality of the climatology under the hood becomes important. Assuming persistence is clearly not ideal. Unfortunately there are also several issues surrounding marine climatology:
- Firstly, the information is, by nature, the mean or average conditions. Because of the scarcity of data, it usually covers a monthly period and climatology grids only have a 1 or 2 degree horizontal resolution. In practice this may not be much of an improvement over persistence.
- Secondly, it is not enough to know that the mean wind speed is 20 knots if the month contains 2 weeks of light winds and 2 weeks of severe gales. We need to know the spread of the data which is measured by the standard deviation. With the mean and the standard deviation we can calculate the probability of events occurring, for example winds exceeding a certain value.
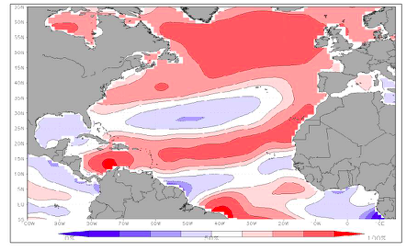
The image below shows the probability of winds exceeding Beaufort Force 5 in the North Atlantic in August. It is worth noting that if a ship’s performance is warranted up to Beaufort Force 4, then it will be out of performance warranted conditions for over 90% of the time for most of the Great Circle route between Europe and North America. However such probabilistic routeing considerations are not reflected in automated routeing software.
StratumFive and FleetWeather are developing a climatology which solves both of these issues, through combining probabilistic analysis with leveraging the state of the art modelling that has been done on past and predicted environments.
About StratumFive: For more than a decade StratumFive has been delivering leading cost-effective voyage monitoring solutions and now provides services to more than 12,000 ships through its global network, which includes the FleetWeather operations centre in the USA and its 50 year history of service excellence.