Climate is understood to be the average weather for a specific area over a period of time. However, when climate varies, it is often referred to as climate variability (CV).
So, what exactly is climate variability? According to the World Meteorological Organisation (WMO), climate variability is defined as “variations in the mean state and other statistics of the climate on all temporal and spatial scales, beyond individual weather events” and is “used to denote deviations of climatic statistics over a given period of time.” Not to be confused with ‘climate change’, climate variability takes in consideration only changes that occur in smaller time frames, such as a month, a season, or a given year, whereas climate change is over longer periods of time as the Earth’s system evolves.
Although a global concern, climate variability also plays a significant role in maritime shipping; both positively and negatively. Here are 5 ways climate variability has affected the shipping industry.
Panama Canal drought
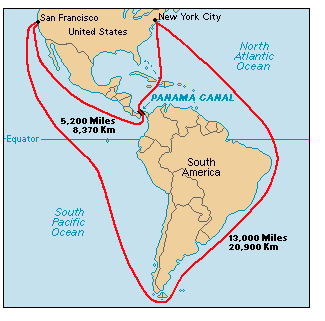
Since 1914 when it first opened, the Panama Canal has been fundamental to the shipping industry for transporting goods linking the Pacific and Atlantic Oceans (see Fig. 1) by providing access to a 50 mile (80.47 km) shortcut, significantly reducing voyage time and fuel consumption.
However, for the last four to five years, the canal has been threatened by the recurrence of drought and it is thought that climate variability may be the greatest contributor. In fact, in 2019, “the Panama Canal watershed experienced its fifth driest year in 70 years” (MarineLink).
Consequently, the Panama Canal Authority (PCA) had to reduce the number of daily reservation slots to transit the canal to 27, down from 32, equivalent to the number of lanes available during a lane outage. An additional fee was added to the existing toll to use the canal, up to 10%, dependent on the current water level of Gatun Lake at the time of transit to aid in conservation efforts and future sustainability projects (Schuler 2020). Only recently (as of September 2020), the PCA increased the maximum draft to 15.23 meters (50 feet), the maximum offered by the neopanamax locks, which has enhanced the economic benefit of using the canal.
Biofouling
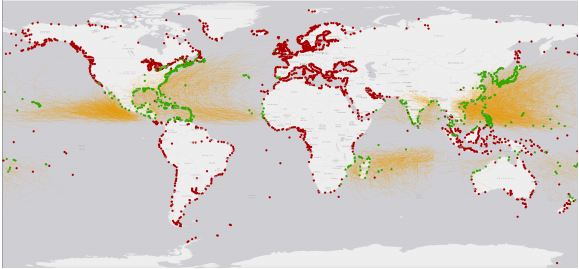
Biofouling is a term used to describe the settlement and growth of marine plants and animals on the submerged portions of marine installations, structures, and ships as shown in Fig. 2. This issue becomes exceptionally noticeable for a vessel during periods of prolonged inactivity, which can accelerate hull and propeller fouling, and can drastically disrupt the performance of the vessel when transiting again.

Fouling leads to significant increases in hydrodynamic resistance by up to 40%, causing a vessel to reduce speed for a given RPM setting and increase fuel consumption, generating more emissions.
Several factors contribute to biofouling, including water clarity, temperature, and salinity, waves and currents, and the concentration of chlorophyll, rendering a well understood and predictable rate of biological growth. Many of these factors are distinctly correlated with climate variability. For instance, growth rates are heavily increased during summer months and within areas of tropical waters, as well as areas with stagnant water unaffected by waves and currents (while a vessel is in port, for example).
Increased hurricane/tropical storms
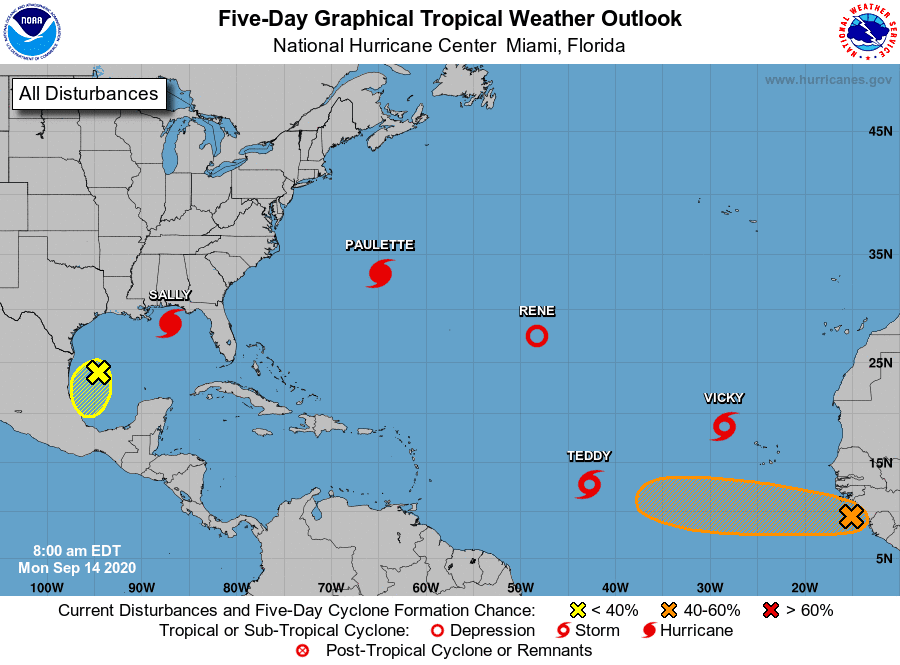
On average from 2010-2019, the Atlantic basin sees 15 named storms with about half becoming hurricanes and 3 being major hurricanes. The 2020 NATL hurricane season set a series of new all time records: 30 named systems, 13 hurricanes and 6 major hurricanes. Other records include it was the 5th consecutive year with above-average hurricane activity and with a Cat 5 hurricane in the Atlantic. Ten systems rapidly intensified by at least 30 knots in less than 24 hours and three named storms underwent 36 hour intensification by at least 86 knots (100 mph). Other highlights include 5 tropical cyclones at the same time on 14th September, as seen in Fig 3.
Hurricane season runs 1 June to 30 November with August-September as the peak months, but November was surprisingly active and was the first time since records began that two major hurricanes were recorded in this month and so close in space and time with devastating impact on Nicaragua and Honduras. The factors behind this are thought to be warmer than normal sea surface temperatures and the development of La Nina, with weaker trade winds preventing colder deeper water from moving to the surface, suggesting climate variability played a key role for the 2020’s record season. Of note, given the recent increased tropical cyclone activity in the Atlantic basin in May over the last few seasons, the National Hurricane Center (NHC) will begin providing tropical weather outlooks for the Atlantic basin beginning 15th May 2021.
Increased risk to port infrastructure
Many ports are susceptible to encountering storms as about a third of the world’s ports are located in areas prone to tropical storms, and regularly experience natural hazard events.
In accordance with Becker (2018), facilities and port infrastructures serve as the convergence points between transportation and logistics thus are crucial in defining the smooth operation of global supply chains. Conversely, if the destination port’s infrastructure cannot handle disruptions due to climate-related hazards, it puts a kink into shipping operations.
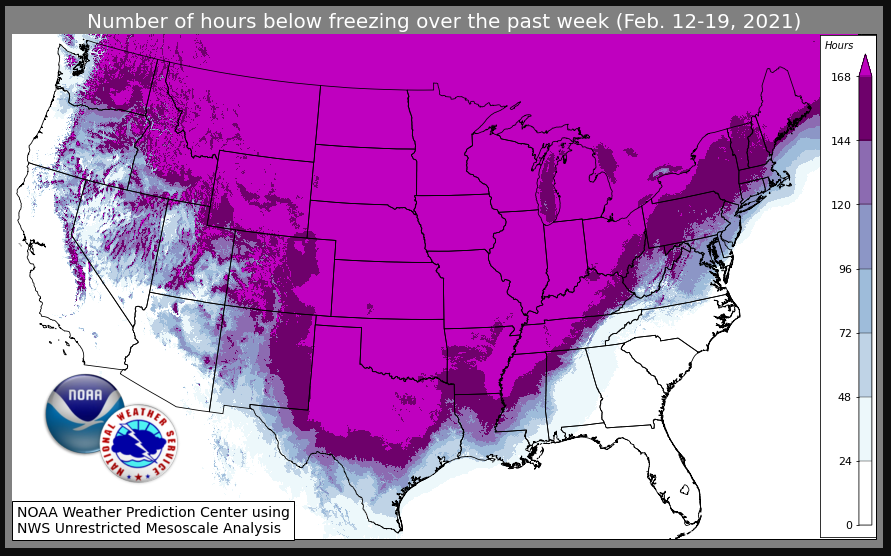
Not all natural hazards are the results of a tropical storm though. Recently, a winter storm that occurred in mid-February left much of Texas covered in ice and atypical amounts of snow. This event was due to a disruption of the Arctic polar vortex that encouraged the polar jetstream to become unstable for several weeks, simultaneously with other weather patterns, it created conditions that were favourable for an extreme cold air outbreak over the central CONUS.
These freezing temperatures seriously disrupted the petrochemical plants along the Gulf of Mexico coastline, greatly affecting the shipping industry. According to Reuters, this winter storm halted the port’s daily production of more than 3 million barrel refining capacity and took several days to return to normal.
Opens up newly expanded trade routes
Climate variability does not only negatively impact the shipping community. In the winter, the Northern Sea Route (NSR) is completely impassable due to ice, but with the help of icebreakers, can be used during summer and autumn. However, in 2020, the Arctic Ocean remained ice free much longer in the season than typical, as sea ice extent was the lowest on record since 1979.
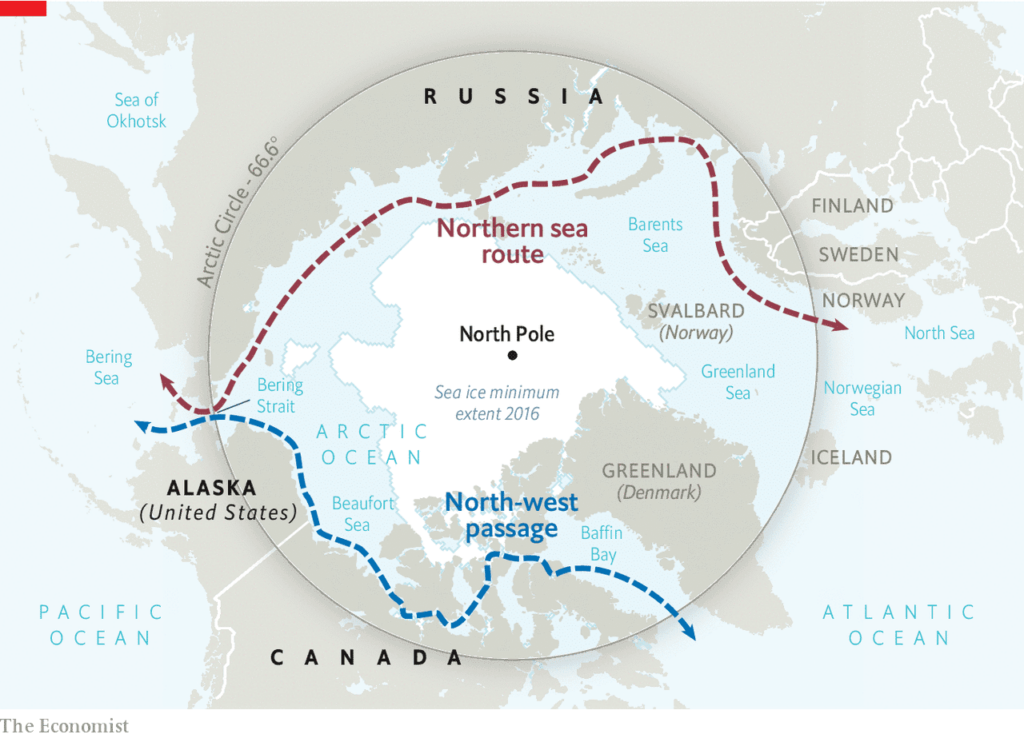
For years, the NSR has been used for shipping, but could only be used for a small portion of the year. In 2012, Novatek shipped LNG to Japan for the first time through the NSR, while Maersk was the first shipping company to send a container vessel, as a trial, six years later in 2018. With the reduced sea ice extent, the NSR opened up sooner than previous years, which has become extremely favourable for the shipping industry. As the NSR becomes widely utilised, shorter voyage time would not only reduce fuel consumption; it would allow more goods to be transported from one port to another in a quicker period of time, avoiding the need to transit the Suez Canal.
Stay safe and connected.