September arrived signalling the peak of the 2024 Pacific typhoon season. The FleetWeather team at Pole Star Global’s Podium have been closely monitoring hurricane activity to get a clear picture of how the season has unfolded so far. Based on FleetWeather’s finding, this article gives you exclusive insights for you to take a proactive approach and prepare for future weather events in the Pacific region.
Overview of 2024 Pacific Typhoon Season: Key Findings
Reverting to Pole Star’s initial outlook in May, the forecast anticipated a shift fromEl Nino to La Nina later in the year. As a result, i a below-average number of tropical cyclones in the Western and Central Pacific was predicted. In the Eastern Pacific, while La Nina tends to surpress hurricane activity. Here, above normal sea surface temperatures (SST) off the coast of Mexico were highlighted as a poential driver of typhoon development. . For that reason, an above-average number of typhoons is expected in the Pacific region in 2024.
Typhoon Activity in the West Pacific
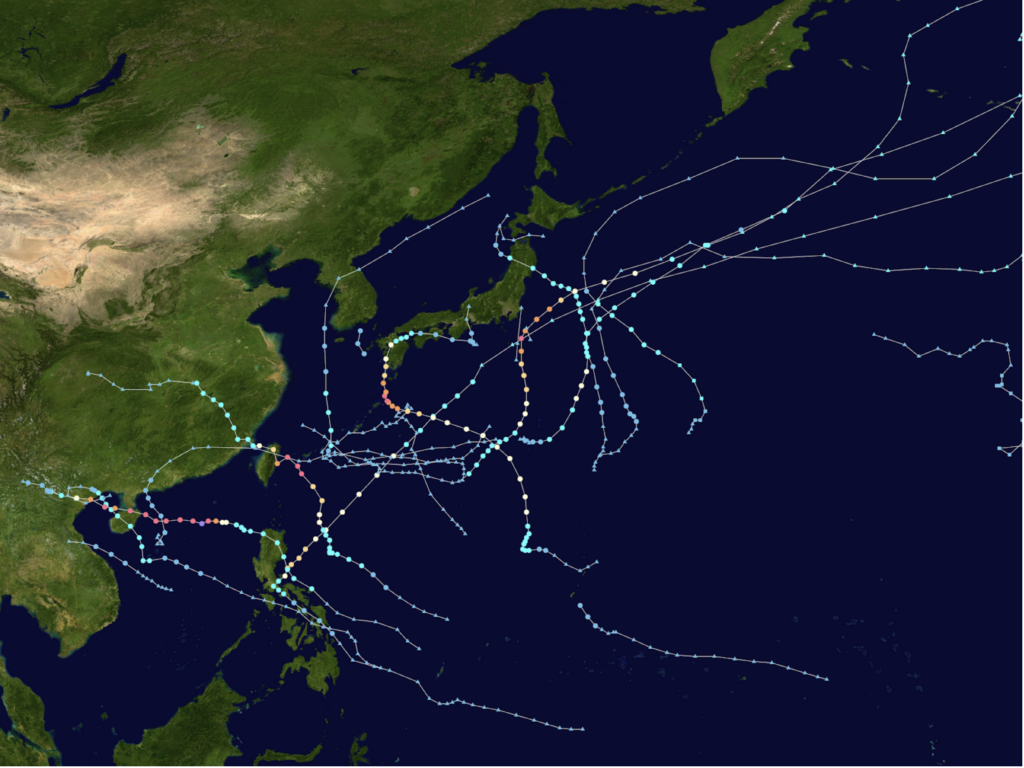
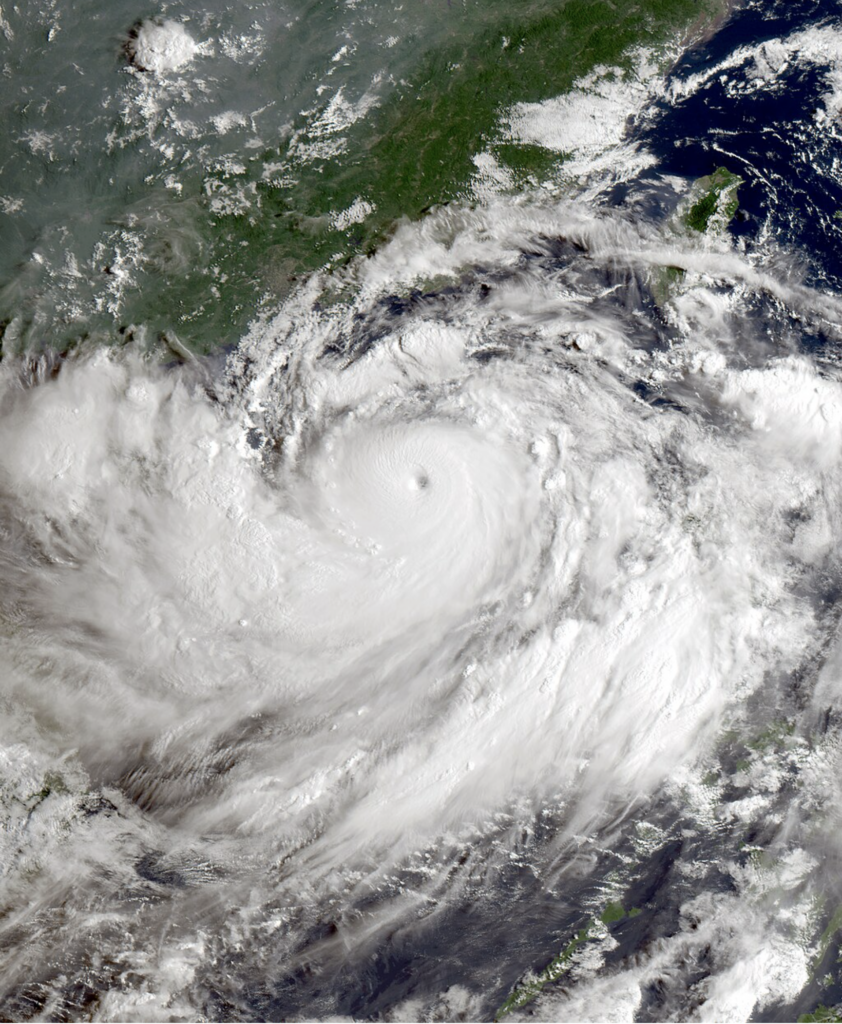
Starting out in the West Pacific, since May 23rd, a total of 19 tropical cyclones (plotted in Figure 1) have formed. Out of these, 12 developed into tropical storms. Of these, five became typhoons, including the violent typhoon Yagi (refer to Figure 2). Yagi tracked its way from Luzon Island in the northern Philippines, moving west-northwest over Hainan Island and the Leizhou Peninsula, and eventually reaching northern Vietnam. Yagi intensified into a Category 5 equivalent super typhoon, with 1-minute sustained winds reaching up to 160mph (~140 knots).
Hurricane Activity in the Eastern Pacific
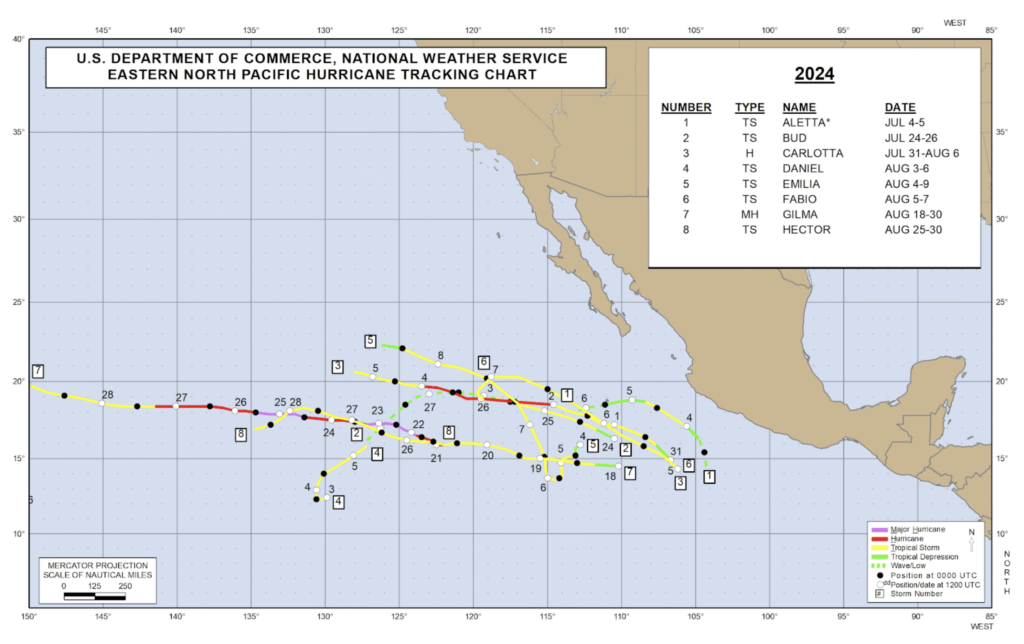
Moving into the Eastern Pacific, since July 4th, all nine depressions developed into tropical storm (see Figure 3). Three hurricanes have spawned. Of these, Gilma was a major hurricane, reaching Category 4 strength with winds up to 130mph (~115 knots). Gilma remained over open waters during its peak intensity, however it did continue tracking west-northwest towards Hawaii, bringing increased rainfall towards the state as it dissipated.
Comparing 2024 Accumulated Cyclone Energy (ACE) to the Pacific Average
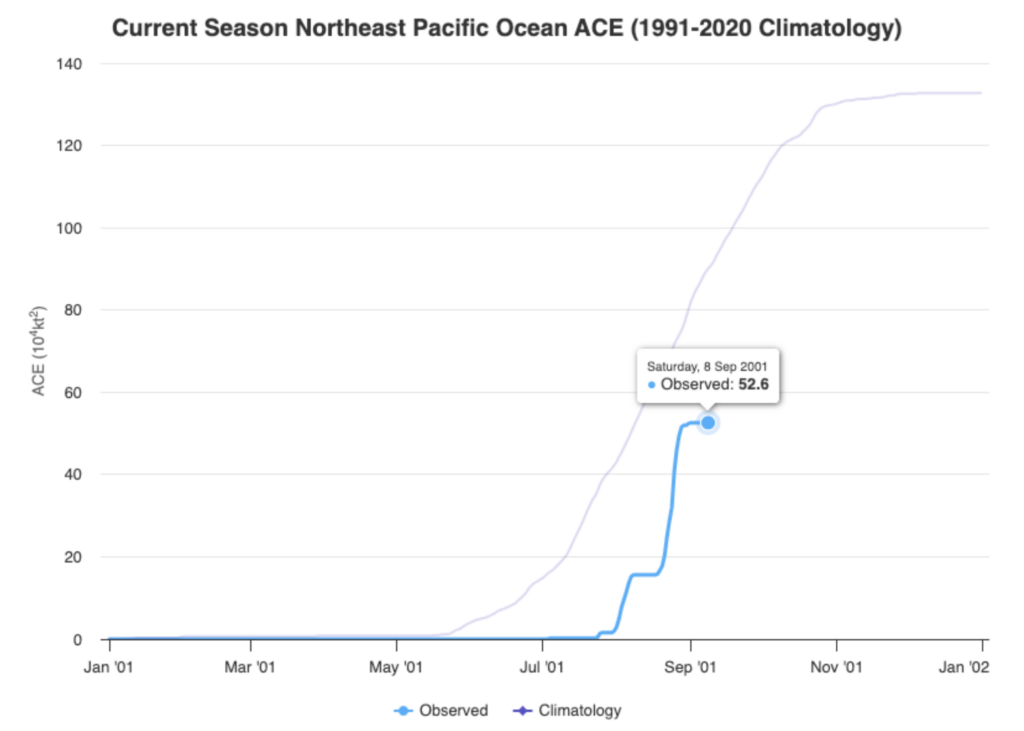
A parameter that is used to assess how active the season has been is the Accumulated Cyclone Energy (ACE). ACE is a metric that takes into account both the intensity and duration of the tropical cyclones in a season.
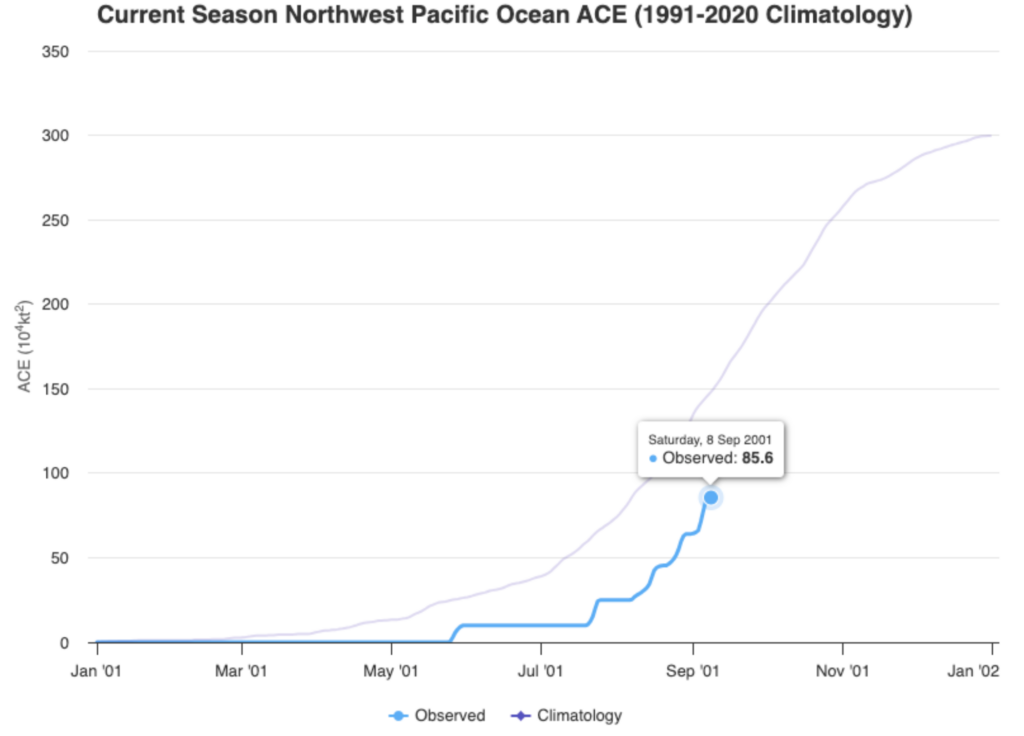
Compared to the average ACE values from 1991-2020, the 2024 season is falling short. As of September 8th, the Western Pacific has an ACE of 85.6 (see Figure 4), while the Eastern Pacific has an ACE of 52.6 (see Figure 5). Both are below the average for this time of year.
Both sides of the Pacific have shown below-average ACE values so far this season. To understand why, the first step is examine the role of El Nino.
Understanding the Cause: El Nino and La Nina
El Nino and La Nina are opposite phases of the El Nino-Southern Oscillation (ENSO) climate pattern, which impacts global weather and climate.
- During El Nino, warmer SSTs pile up along the coast of South America.
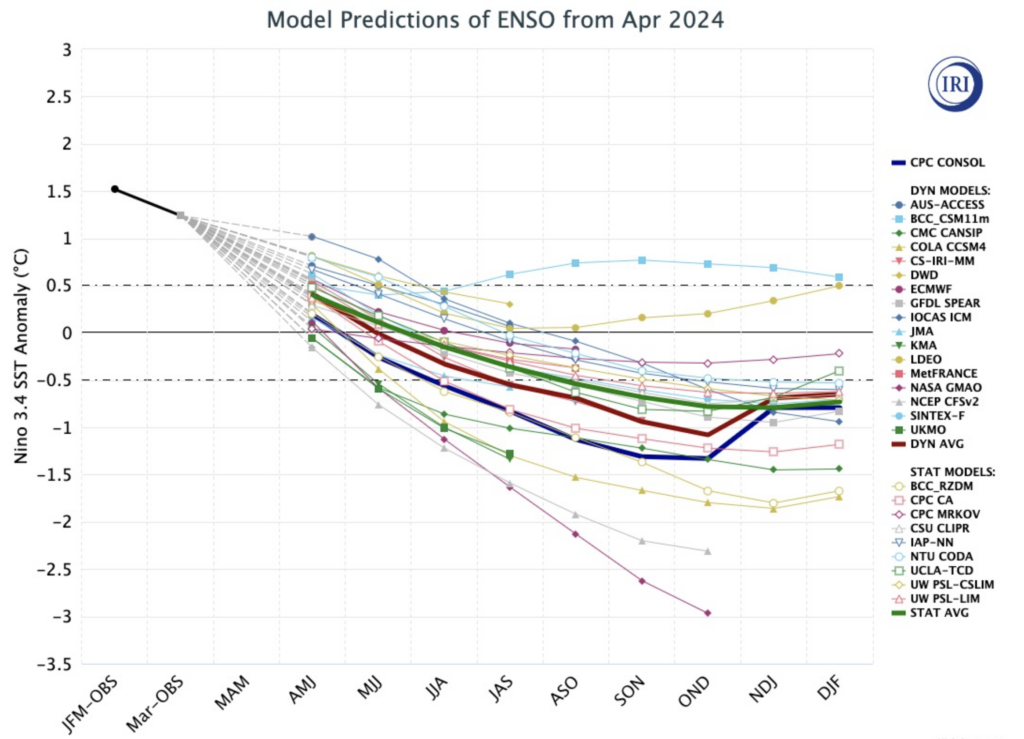
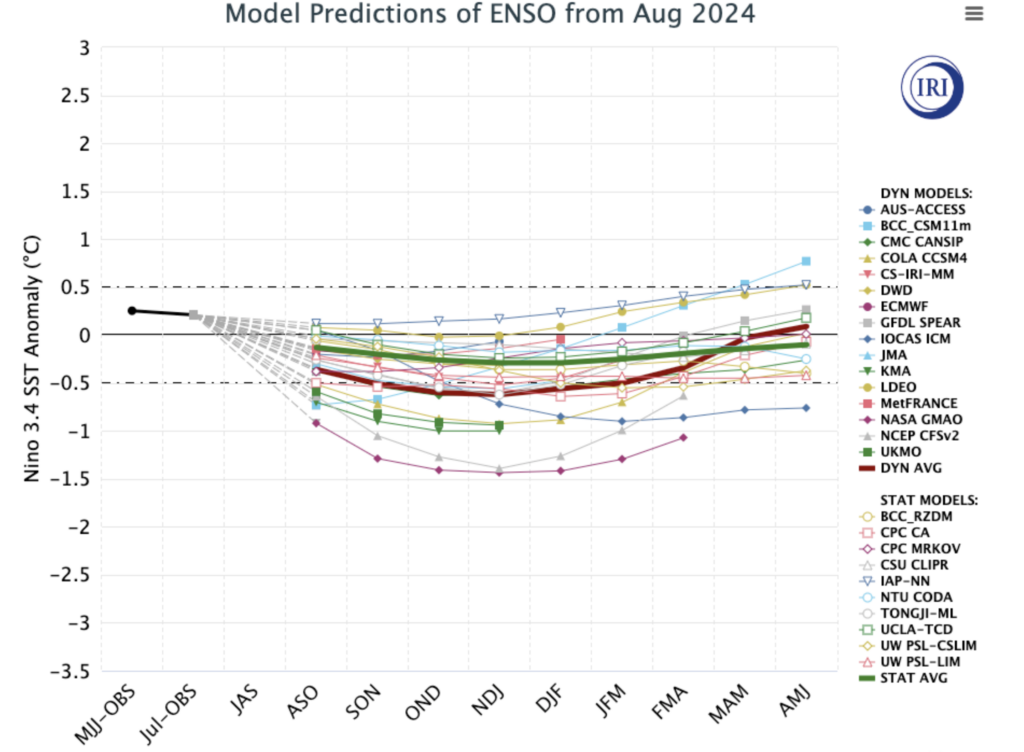
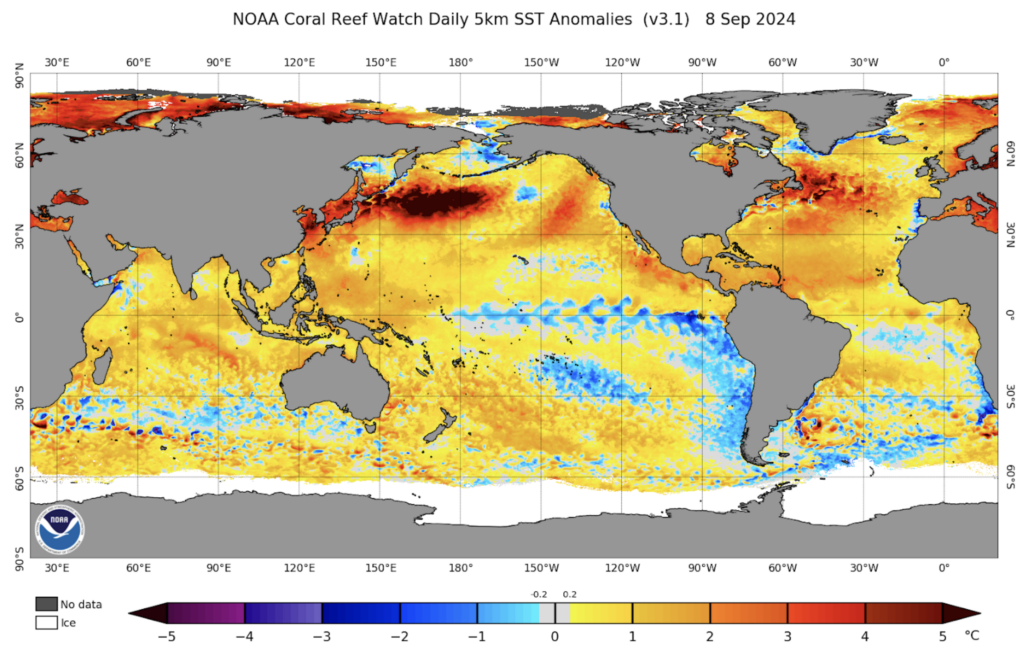
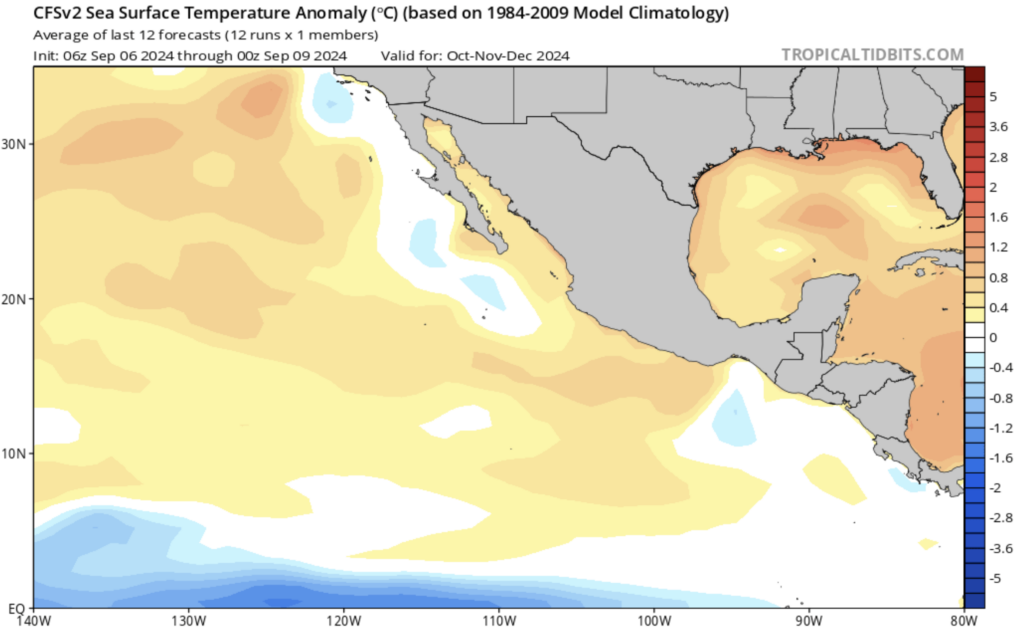
- During La Nina, cooler than average SSTs occur along the coast of South .This season and as expected,the climate pattern has shifted from El Nino to neutral conditions. Following this, in September, the Climate Prediction Center has issued a La Nina Watch, indicating that La Nina is likely to develop through to the end of the season, though it may be relatively weak (see Figures 6-7). Supporting this prediction, SST anomalies show a cold stretch of water extending west from South America, which is a key sign of La Nina (see Figure 8).
While the incoming La Nina conditions are expected to reduce tropical cyclone activity in the back half of this season, this isn’t the only factor to consider.
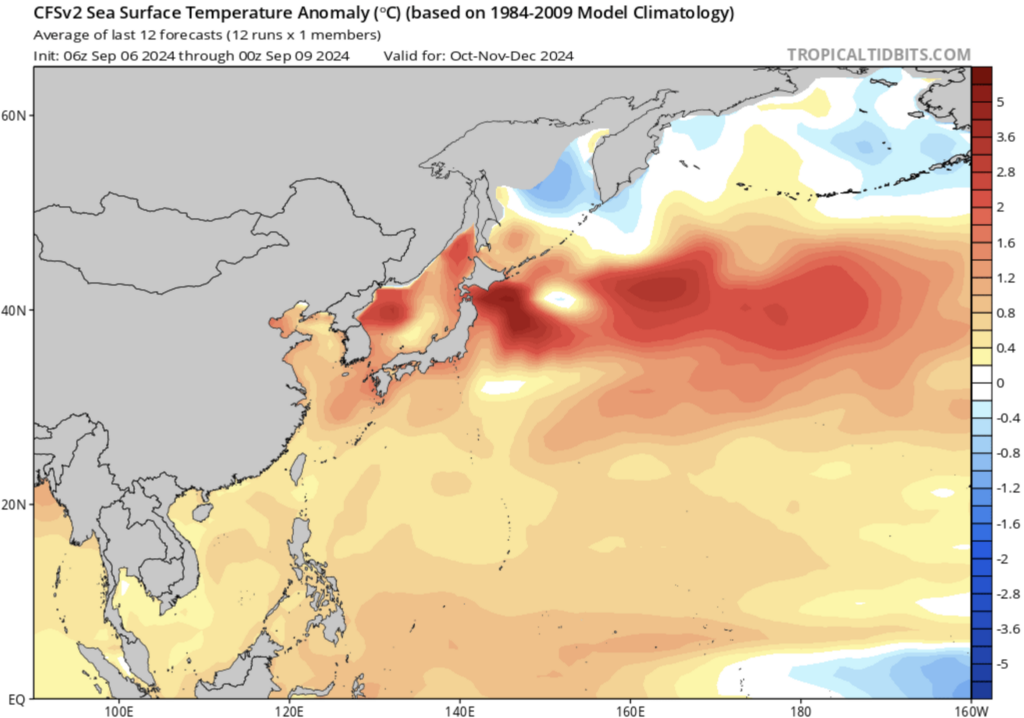
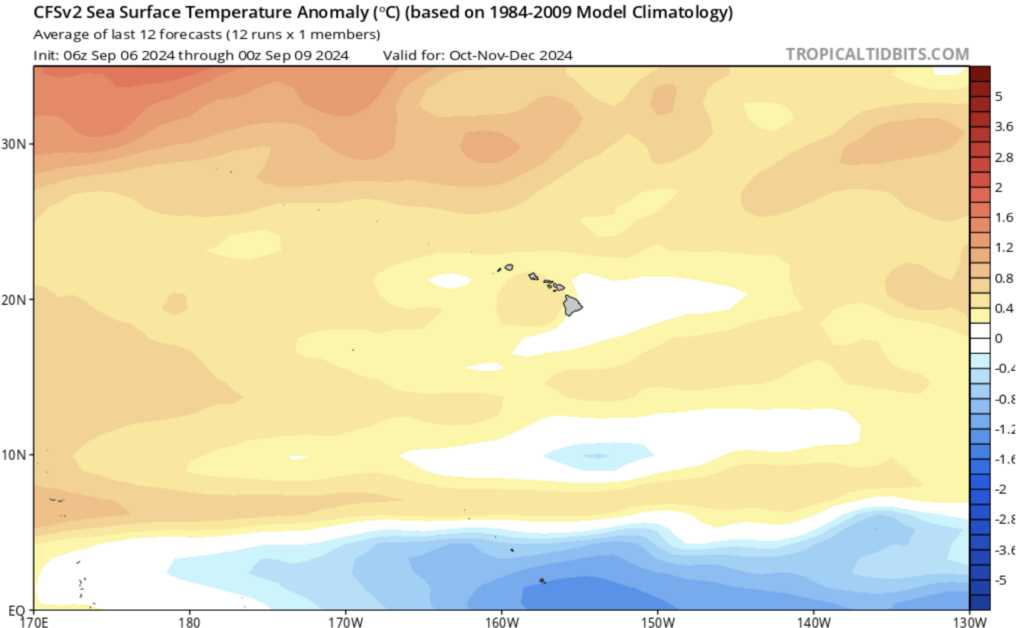
To understand the situation fully, you should consider SST in other areas too. In this instance,l models predict that SST in the North Pacific will be higher than normal through to the end of the season (see Figures 9-11)This can contribute to the development of storms, particularly noticeable east of the Philippines and off the Mexican Riviera.
Another parameter that can assist us is the placement of the Madden Julian Oscillation (MJO). The MJO is a large eastward moving cluster of moisture and instability that creates favorable conditions for tropical cyclones to develop.
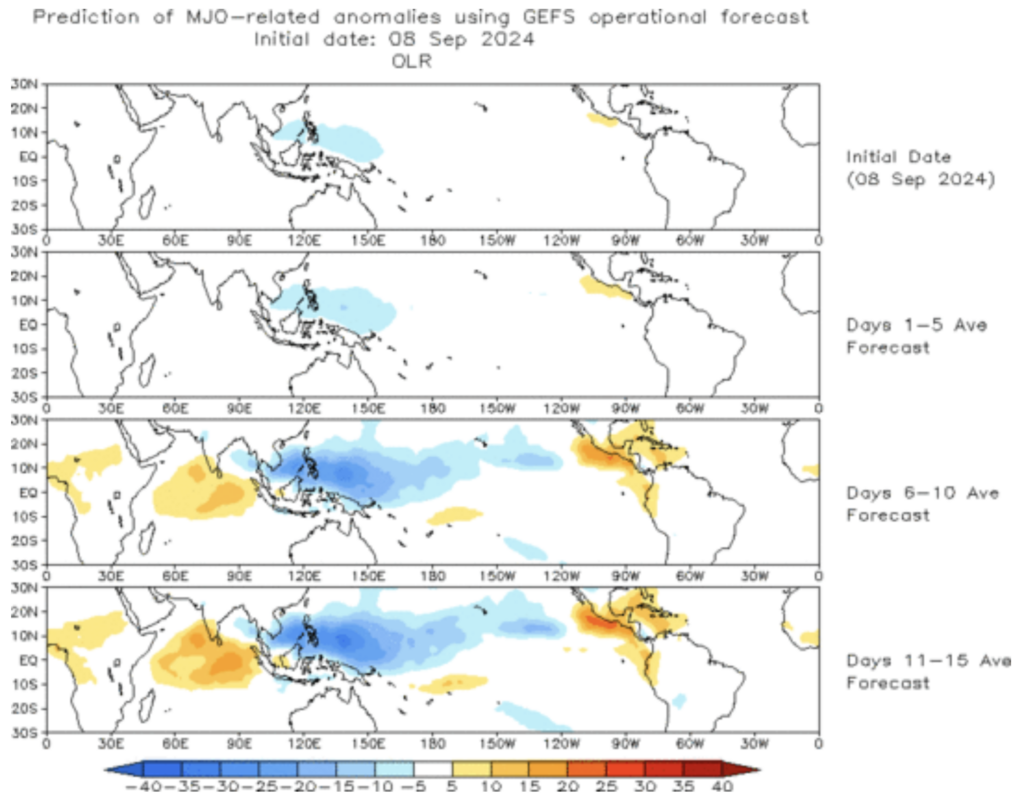
A related parameter that is used to predict the track and intensity of the MJO is Outgoing Longwave Radiation or OLR. Please refer to Figure 12. Blue areas indicate more cloud cover, while orange areas show less cloud cover. More clouds can help tropical storms develop. This means the large blue area in the Western Pacific means more clouds and therefore an increased change of tropical storms until the end of September and into October. On the other hand, the orange areas in the Eastern Pacific suggest fewer clouds, which could reduce the chance of tropical activity.
The FleetWeather team have tracked 28 tropical systems in the Pacific so far, which is about average for this time of year. It’s important to note that September is the peak of the season, and storms can still form later in the year if the conditions are right. For these reasons, It is always prudent to monitor any disturbance that could pose an impact whether on land or at sea.
The team at FleetWeather continues to monitor 24/7/365 across the world providing safe and efficient weather routing to vessels. Please reach out to our team of accredited marine routers at any time to activate Pole Star’s weather routing and forecast services. Pole Star Global is committed to providing optimum guidance to your vessels for any future tropical cyclones or heavy weather that threatens their voyage.
Stay connected and safe.