For the East Pacific, the official hurricane season stretches from May 15th until November 30th. In the West Pacific, the typhoon season runs year-round but there are certainly seasonal peaks, the strongest being in September similar to the East Pacific peak.
Last year’s La Nina resulted in an above average hurricane season for the Eastern Pacific basin with 19 named storms, 10 hurricanes, and 4 major hurricanes. On the other end, the Western Pacific was below average with 36 depressions, 25 storms, 10 typhoons, and only 3 major typhoons recorded. This year’s outlook could result in some slight differences which will be discussed in this blog.
This year a positive El Niño ENSO signal has developed over the last several months, which means sea surface temperatures in the tropical east Pacific will tend higher. Such El Niño events are synonymous with above normal tropical cyclone formation in both the East Pacific and West Pacific. So far this year, there have been two named systems within the West Pacific, TD Amang, which impacted the Philippines during April, and Tropical Storm Sanvu which formed over the open waters well Northeast of Papua-New Guinea in the 2nd half of April.
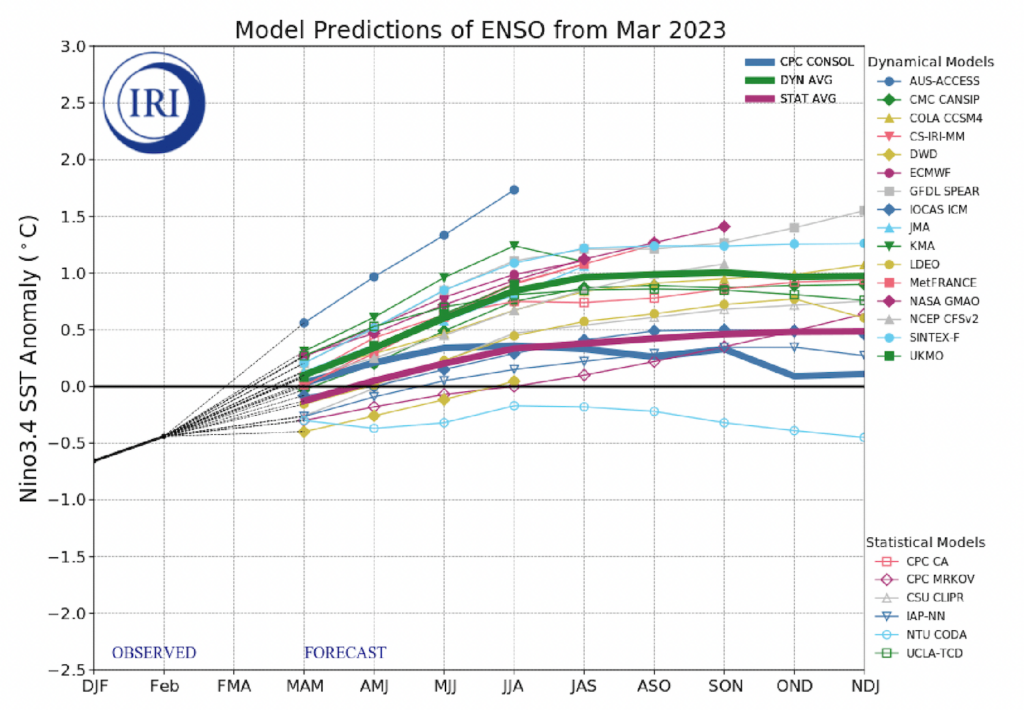
Fig 1: Forecasts of sea surface temperature anomalies for the Niño 3.4 region (5N-5S, 120W-170W). Figure updated 20 March 2023 by the International Research Institute (IRI0 for Climate and Society. Source here.
This increase in tropical activity for both basins is a result of a weakening in the Walker Circulation, which can be described as as a Pacific overturning cell, or an Atmospheric loop, with areas of rising and sinking air on either side of the cell, (see figure 2 below) and further eastward extent of the equatorial trough and subsequent wider coverage of deep convection in the tropics and subtropical pacific, where convection is colocated with the warmest sea surface temperatures (SSTs).
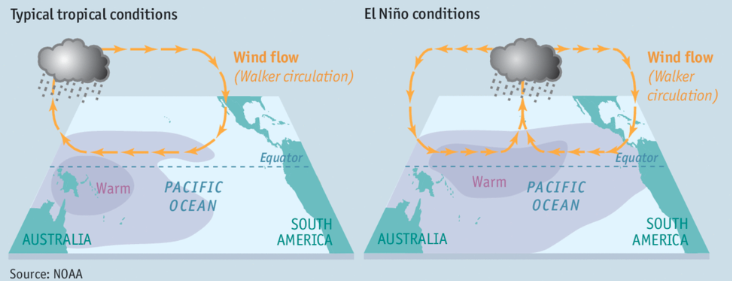
Fig 2: (Atmospheric depiction of Walker Circulation over the Equatorial Pacific normally, on left, vs during El Nino, on right)
Deep layer shear tends to remain weaker and stronger low level convergence can occur where equatorial troughs and vorticity are both prevalent.
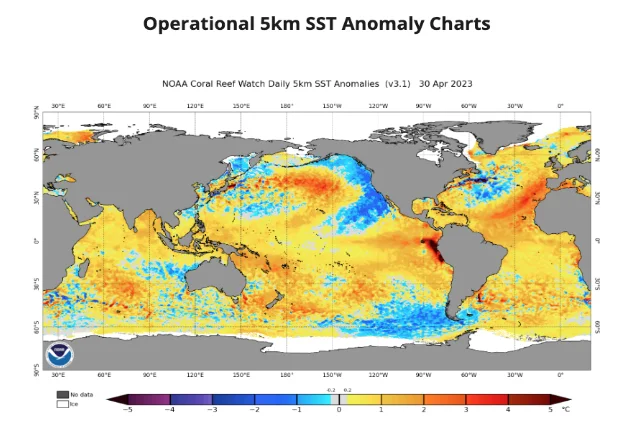
Fig 3: (NOAA 5km SST Anomalies Map: 30th April, 2023)
The Eastern Pacific top analog years for the current SST configuration (Fig 1) across the Pacific Ocean all resulted in above average hurricane seasons. Those years include the following: 1972, 1975, 1982, 1997, 2006, 2008, 2009, 2011, 2012. All but two of the nine analog years mentioned above occurred when a negative PDO (Pacific Decadal Oscillation) was observed at the same time as an El Nino ENSO signal was present, similar to what is currently being observed across the Northern Pacific at this very moment. A negative PDO is defined by warm SST anomalies across the interior North Pacific and cool SST anomalies along the North American coast, whereas the opposite is true for a positive PDO, with SST’s are cool across the interior, and warm along the Pacific coast. So what does this pattern mean? Ultimately, there should be a near normal to above average Eastern Pacific Hurricane season given the historical analog data presented. The warm SSTs across the basin along with cooler SSTs over the mid-latitude Eastern Pacific will help to direct low level convergence off Western Mexico and points to the west.
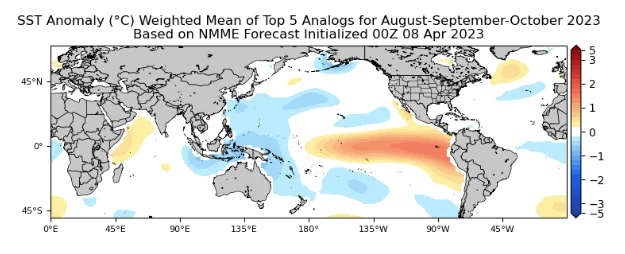
Fig 4: (NMME Weighted Top 5 Analogs SST configuration Aug-Oct, 2023 courtesy of Tropical Tidbits)
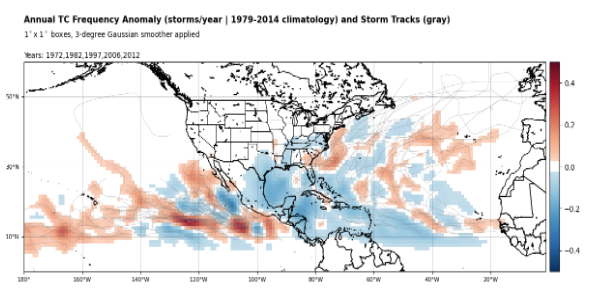
Fig 5: (TC Frequency Anomaly for Top 5 Analog years with storm tracks, courtesy of Tropical Tidbits.)
The Western Pacific could also produce an above normal amount of tropical cyclones this year as warmer than normal SST anomalies persist over the subtropical and equatorial regions of the North West Pacific. Anomalous warm ocean temperatures and increased Ocean Heat Content (OHC) during El Nino years, provides more “fuel” for tropical cyclone genesis to occur further east and southeast of the Philippines and China. This increased coverage of tropical cyclones off the Philippines and China is a direct result of the westward extent of warm SSTs associated with an El Nino and the weakening of westward trade winds near the equator. Subtropical ridging during El Nino years tends to form further east over the open subtropical Western Pacific compared to La Nina years. For this reason, recurving tropical cyclones over the open ocean are more frequent and result in a decrease in landfalling Tropical Storms and Typhoons over Asia given the upper level steering currents (winds). Long story short, an above average season with an increase in the number of tropical cyclones and larger spatial coverage of systems are more likely to occur this year.
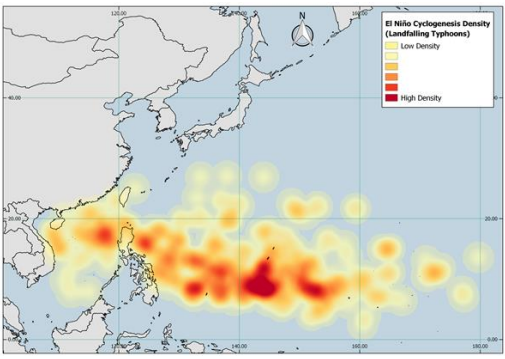
Fig 6: (Heat map of Tropical Cyclogenesis locations during El Nino years based on climatology, courtesy of Risk Management Solutions)
The year 2023 should bring with it an active Tropical Cyclone season to the North Pacific as a whole. Given the state of ENSO favoring an ongoing El Nino event, oceanic and atmospheric conditions will coalesce to create an environment favorable for tropical cyclone formation and longevity. For this reason some systems could be stronger than normal and more frequent compared to average or below average seasons characterised by La Nina or Neutral ENSO phases. As always, many other parameters and teleconnections such as Madden Julian Oscillation (MJO) can determine the variability of cyclone activity over the long tropical season across the Pacific. However, when looking at historic analog data, current model forecasts, and ocean analyses an active season should be more likely than not. Stay connected and safe.