The Atlantic Hurricane season is almost upon us. Beginning on June 1st, the season will officially begin and lasts until November 30th. With the season nearing, we like to look ahead and share our predictions for what the upcoming season may have in store.
A look back to the 2022 Season
The 2022 hurricane season will go down as an underachiever based on all of the preseason factors. There were a total of 14 named systems, 8 of which reached hurricane status and only 2 of which were categorized as major Hurricanes. While the season was still considered active, a persistent Saharan Air Layer inhibited the formation of many hurricanes by covering the North Atlantic with dry, dusty air.
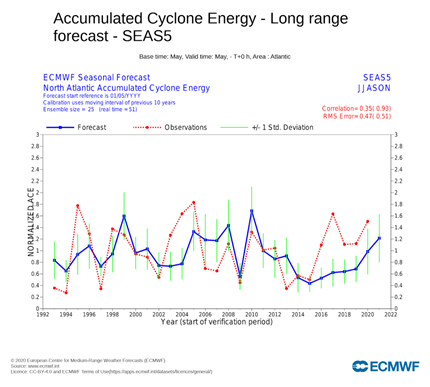
Fig.1) Image of dust blowing off the Sahara Desert from the NOAA-20 satellite, June 2020. (Source: NOAA)
A changing ENSO Pattern
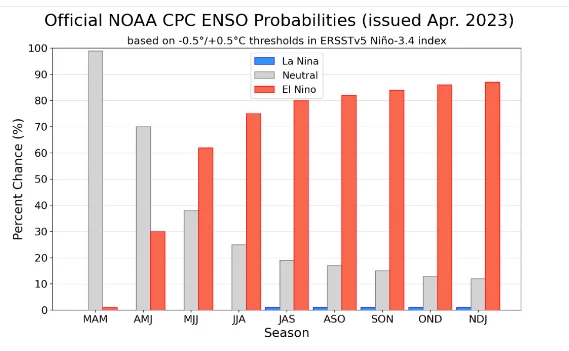
Changing gears, lets take a look at some of the major factors that could impact the 2023 season. One of the biggest differences for the 2023 season versus the previous few years could be the transition in the El Niño-Southern Oscillation (ENSO) pattern from La Niña to El Niño. This would end nearly three years where we were in an ENSO Neutral/La Niña pattern.
Source: cpc.ncep.noaa.gov/products/precip/CWlink/MJO/enso.
Forecast models are quite confident that we will enter into an El Niño pattern by this summer (62% chance from May-July) increasing steadily through the late summer/fall with nearly a 90% probability of El Niño by the winter. While the models are confident in the overall shift to El Niño, there remains a larger spread in the exact strength of the upcoming El Niño.
Fig.3) Sea Surface Temperatures (SST) forecasts for NINO 3.4 from ECMWF and NCEP
Source: Climate.copernicus.eu
In the anomaly forecasts from both NCEP and the ECMWF (Fig. 3) we can see that both models agree in the steady increase to El Niño through the summer. While the ECMWF does look quite a bit stronger, it is important to remember that the ECMWF has been shown to have a warm bias when forecasting ENSO, especially before the ENSO predictability barrier in May.
This change to El Niño could prove to be a bit of a limiting factor in hurricane development due to increased wind shear and generally greater atmospheric stability across the Atlantic Ocean, but this dampening effect is also dependent on the strength of El Niño.
Sea Surface Temperatures
Next, we will take a look at Sea Surface Temperature (SSTs) anomalies across the North Atlantic Ocean (Fig.4). Warm seas (typically above 26.5 degrees celsius) are one of the essential ingredients for the development of a tropical storm. Higher SSTs result in higher evaporation rates, which means more moisture will be in the air to fuel the thunderstorms of a developing tropical cyclone.
SSTs across much of the Main Development Region (MDR)/Eastern Atlantic are very warm, due to generally weak trade winds across the basin resulting in decreased upwelling/mixing.
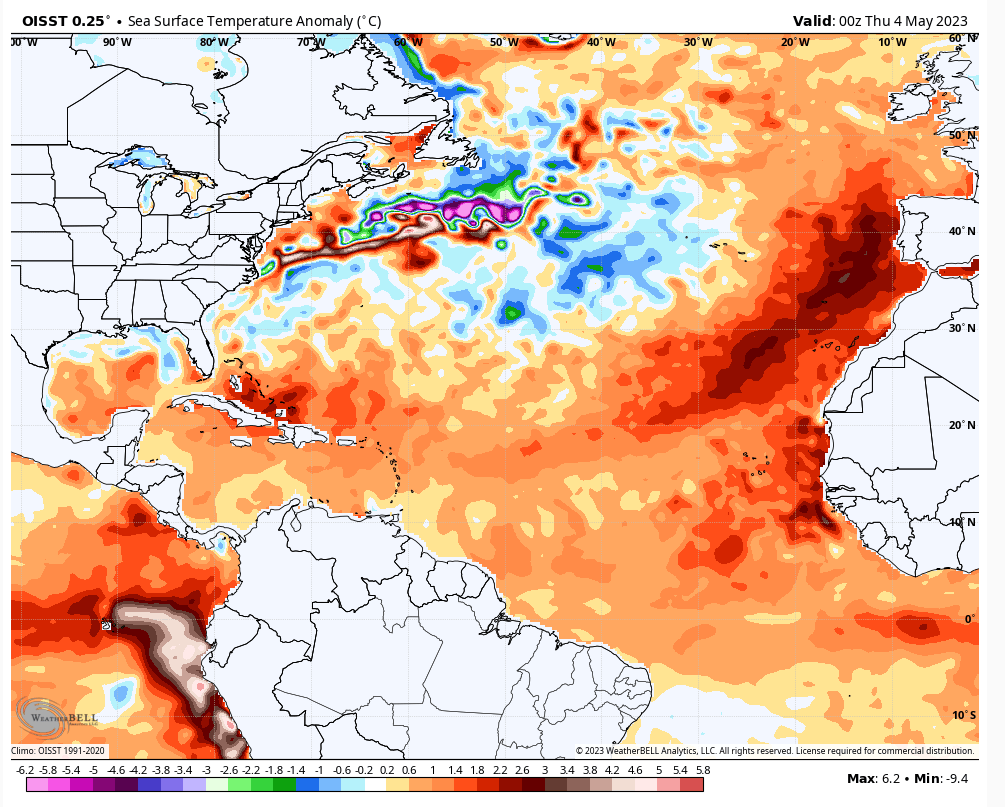
Fig 4.) Atlantic Ocean Optimum Interpolation SST (OISST) 0.25° SST Anomaly Analysis.
Source: maps.Weatherbell.com
Elsewhere in the Atlantic, we have a blob of cooler waters in the Northwest portion of the basin and average to slightly above average temperatures in the Caribbean Sea and Gulf of Mexico. The above average MDR temperature anomalies will need to be closely monitored as we move through the spring.
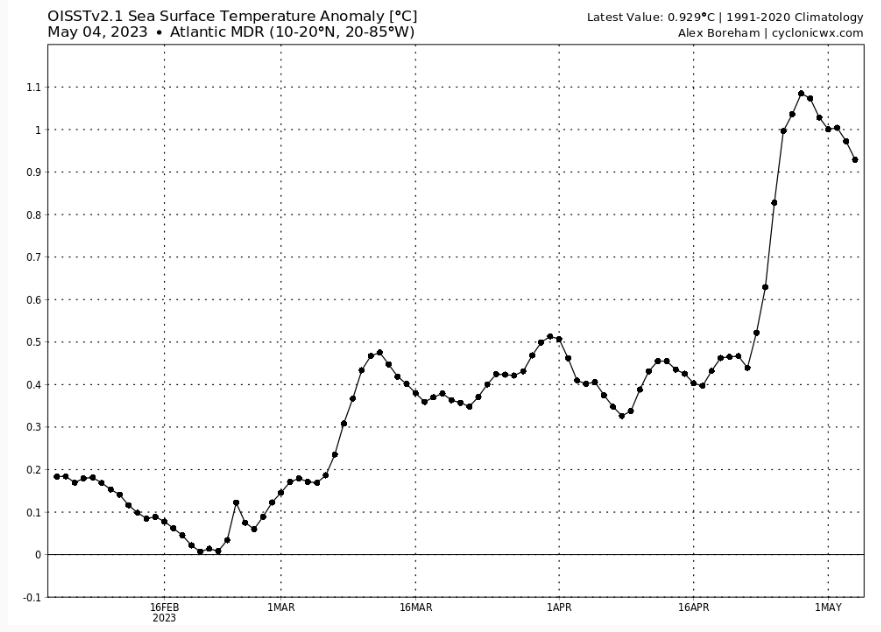
Fig.5) SST Anomaly Analysis for the Atlantic Ocean Main Development Region (MDR)
Source: Cyclonicwx.com
Using the C3S multi-system April Seasonal forecast we can take a look at the SST forecast for the upcoming season, the below chart showing from July-September. This multi-model forecast shows a very favorable likelihood of seeing above average temperatures across all of the Atlantic main development region, extending into the Gulf of Mexico and subtropics.
Looking back to the Pacific Ocean and the ENSO region, we can see that this multi-system forecast also agrees with the likelihood of a transition into El Niño, with above average temperature across the Central/Eastern Tropical Pacific Ocean.
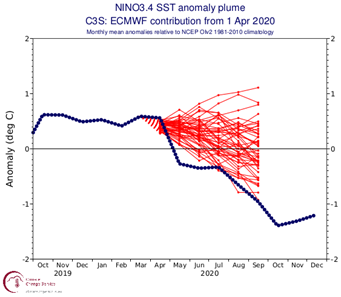
Fig.6) C3S Multi-system (ECMWF;UKMET;METEO France;CMC;NCEP;JMA;ECCC) April Probabilistic SST anomaly forecast for July-September. Source:https://climate.copernicus.eu/charts/packages/c3s_seasonal/
Accumulated Cyclone Energy (ACE)
Another variable we will examine is the forecasted Accumulated Cyclone Energy (ACE) across the North Atlantic Ocean. ACE can be used to help determine how active a hurricane season may be, by expressing the total energy released by a tropical cyclone over its lifetime. ACE takes into account both the strength of a hurricane (Wind speed) and its duration.
Fig.7) ECMWF May forecast of Normalized accumulated cyclone energy (ACE) based off historical averages, for the Atlantic Basin between April-November. Source: Climate.copernicus.eu
This year’s ACE forecast from ECMWF shows a bit of a drop off from the previous seasons, and is the lowest forecasted ACE values since 2019. It is still just above average, but due to the high degree of uncertainty in this forecast, there remains the possibility for this season to produce a below average number of storms as well.
Analogs
Lastly, we will take a look at some analogous hurricane seasons to try and assess the upcoming season. By selecting years with similar starting conditions, we can use these analogs to help predict the upcoming season. The years we selected for our analogs were 1951; 1963; 1972; 1997; 2002; and 2006. These selected seasons were chosen as they were coming out of an ENSO Neutral/La Niña pattern into an El Niño pattern by mid summer which generally increased in strength through the Hurricane Season. Such seasons averaged 10 named storms, 5 Hurricanes and 2 major hurricanes.
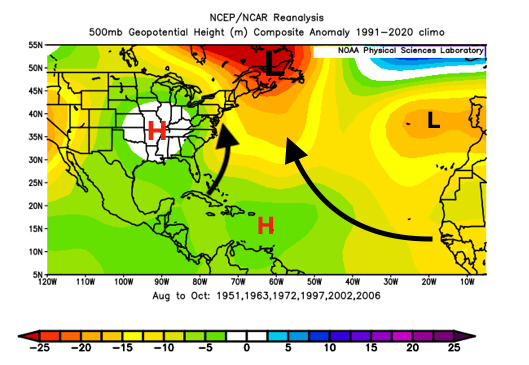
Fig.8) 500mb Geopotential Height Anomalies for August-October in analog years (1951;1963;1972;1997;2002;2006) using the NCEP-NCAR Reanalysis Source: psl.noaa.gov
The average upper air steering pattern through the peak season (August – October) of the analogous years was defined by an area of low pressure over the Canadian Maritimes with an area of high pressure over the United States Midwest and eastern Caribbean Sea. This pattern would result in systems that form within the eastern side of the MDR to recurve well before reaching the US east coast. Based on the analogs, there is also the possibility for a number of storms to develop within the anomalous trough off the SE US coast and northward along the east coast.
The Anomalous area of high pressure over the Caribbean Sea, common in El Niño years, would serve to suppress the formation of Tropical Storms in the western Tropical Atlantic and Caribbean Sea. This increased atmospheric stability in the region would likely result in a below average season in the Caribbean Sea.
Summary
The 2023 Atlantic Hurricane season will be in large part determined by the strength of the upcoming El Niño. While forecast models are in strong agreement that we are going to transition into an El Niño pattern, the exact strength is uncertain. On the Atlantic side, above average SSTs in the MDR and the forecast above average SSTs for the entire basin by peak hurricane season could serve as a spark for the development of many tropical storms, especially if we have a weak El Niño and could allow for an above average season if we have no El Niño at all. Taking everything into account though, we expect to have a just below average North Atlantic Hurricane Season with 12 Named Storms, 6 hurricanes and 2 major hurricanes. The warm seas will help provide fuel for some systems to develop, but the impact of a possibly moderate to strong El Niño pattern would serve to limit the total number of storms.
Stay Connected and Safe