What is the Loop Current?
The Loop Current is an area of fast moving warm water (ocean current) which travels at approximately 0.8m/s, and stretches about 800m deep(2). The Loop current extends from the Yucatan Channel, through the Gulf of Mexico and into the Florida Straits. From the south, the loop current originates as an extension of the Caribbean Current, and then joins forces with the Florida Current and eventually the Gulf Stream Current, exiting the Florida Straits. The loop current also creates Eddy currents around it within the Gulf of Mexico.
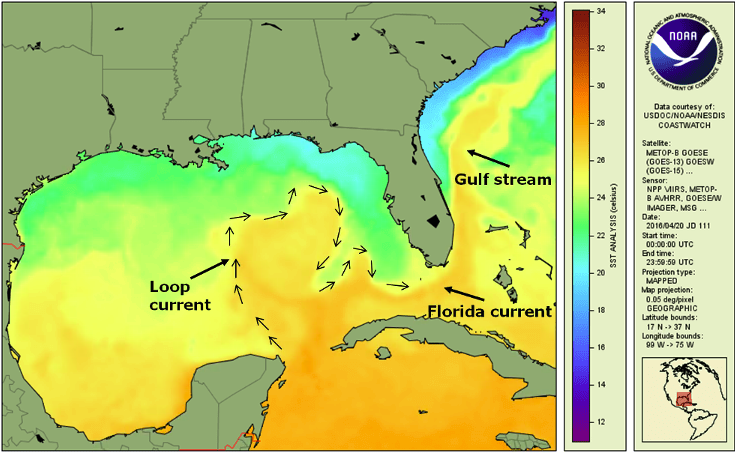
Image 1: The image above displays the Loop Current, and its connection to the Florida and Gulf Stream Currents.(2)
Why is it important for the formation of Tropical Systems in the Gulf of Mexico?
The Loop Current possesses and drives very warm sea temperatures through the Gulf of Mexico, which are extremely important factors in aiding both the formation, and also intensification, of Tropical Systems in that region. Hurricane Katrina is a prime example, becoming one of the most devastating and costly storms in United States history totaling 1,833 fatalities and approximately 108 billion dollars in damages (unadjusted from 2005)(3).
The system was just a Category 1 hurricane making initial landfall over southeastern Florida, and as the system moved west into the warm waters of the Gulf of Mexico at Tropical Storm strength, the Loop Current’s deep reservoir of warm water (among other things) fueled the rapid intensification of the system to a Category 5 hurricane. This is displayed in the image below:

Image 2: This displays the historical satellite imagery overlaid on sea surface temperature data, showing the evolution of Hurricane Katrina, note the rapid intensification when moving over the area of the Loop Current in the Gulf of Mexico. Credit: NASA(4)
The Loop Current then and now
Below are two loops (images 3 and 4), with dates ranging April 29th to May 28th of 2005 and this year (2022) respectively. The beginning of the season which contained several strong hurricanes, including Hurricane Dennis, Hurricane Katrina, and Hurricane Rita, which all passed over the loop current during their life cycle.
Image 3. April 29th to May 28th 2005, Sea Surface Temperatures in the Gulf of Mexico, Caribbean, and SW Atlantic.(5)
Image 4. April 29th to May 28th 2022, Sea Surface Temperatures in the Gulf of Mexico.(6)
A quick comparison and what it could mean
As seen in the images above, compared to April, a rapid warming of Sea Surface Temperatures in the Gulf of Mexico is expected by the end of May 2022 and into early June 2022. The placement of the Loop Current, as well as the formation of a warm eddy to its North-Northwest, is also important here, as it increases the coverage of the warmest waters.
The Loop Current has stretched north of 28 degrees North latitude by the end of May, flowing warmer waters closer to the coast, and throughout the eastern Gulf of Mexico. We saw a similar trend in 2005, as you can see in the images above. With the abundance of warmer waters throughout the eastern Gulf, coupled with the strength and northern reach of the Loop Current, the risk of more powerful tropical systems closer to shore and through the area increases greatly, especially if a system were to track directly over the Loop Current, which is what we saw with Katrina in 2005. Will the similar placement and intensity of the Loop Current, near the beginning of the official hurricane season, contribute to a similar hurricane season to the 2005 season? Time will tell.
Fleetweather Ocean Services continues to monitor Tropical Development in the region and all over the world! Wondering what this Atlantic Hurricane season will be like? Be sure to check out Fleetweather Marine Router William Flamholtz’s blog for a detailed prediction: 2022 Atlantic Hurricane Outlook – Above Average Season in Store?
If you would like to take advantage of our services then please reach out to us and we would be happy to assist!
Stay Connected and Safe!
References:
(2) https://coastwatch.noaa.gov/cw/stories/emilys-post/the-gulf-of-mexico-loop-current.html – NOAA Coastwatch
(3) https://www.weather.gov/mob/katrina – National Weather Service, Mobile/Pensacola office
(4) https://www.nasa.gov/vision/earth/lookingatearth/katrina_seaheight.html – Courtesy NASA/Goddard Space Flight Center Scientific Visualization Studio
(5) NOAA Coral Reef Watch. 2022, updated daily. NOAA Coral Reef Watch Version 3.1 Daily 5km Satellite Regional Virtual Station Time Series Data for Caribbean, Apr. 29, 2005-Mar. 29, 2005. College Park, Maryland, USA: NOAA Coral Reef Watch. Data set accessed 2022-05-23 at https://coralreefwatch.noaa.gov/product/vs/data.php.
(6) Some images courtesy of HYCOM – Hybrid Coordinate Ocean Model, courtesy of Naval Research Laboratory at https://www7320.nrlssc.navy.mil/GLBhycomcice1-12/