Previous articles have looked at the chaotic nature of the atmosphere and how this has significant impact on weather forecasts. As such forecasts typically extend to between 10-14 days ahead. In looking beyond this time horizon extended range weather forecasts (that cover 14 to 30 days ahead) require a different approach that combines meteorology, climatology and statistics.
Ensemble forecasting
The aim of ensemble forecasting is to give an indication of the range of possible future states of the atmosphere. Probability forecasts were initially based on Monte Carlo theory but most have now evolved into a sophisticated mapping operation to target areas of uncertainty. Simplistically, a forecast e.g. T+300, is verified against the corresponding analysis to identify the areas of uncertainty. These are then mapped back using a variety of schemes based on dynamic error growth such as singular vectors, bred vectors or ensemble filters to the original analysis to apply positive and negative perturbations – these are called breeding pairs.
The latest developments have focussed on capturing the uncertainty during data assimilation. Over time the solutions diverge to account for uncertainty arising from the initial state of the atmosphere and approximations in the model physics. The GFS model ensemble is known as the GEFS which has 31 members and now extends out to 35 days ahead. By comparison, the ECWMF model has 51 individual ensemble members that is run daily and extends monthly, while extended range products extend to Day 46. The UK Met office use a 42 member ensemble seasonal forecast run monthly and extends to 6 months.

The members can then be used to create probabilities of an event occurring, e.g. if 16 of 20 members agree the event is 75% certain to happen. When the Ensemble spread is small (large) and the forecast solutions are consistent within multiple model runs, forecasters provide a high (low) confidence measure for the forecast in general. Of course, it is important to recognise that the members may agree in time but not in space and vice versa. For this reason these products fall into the ‘expert’ category and require a human expert for interpretation.
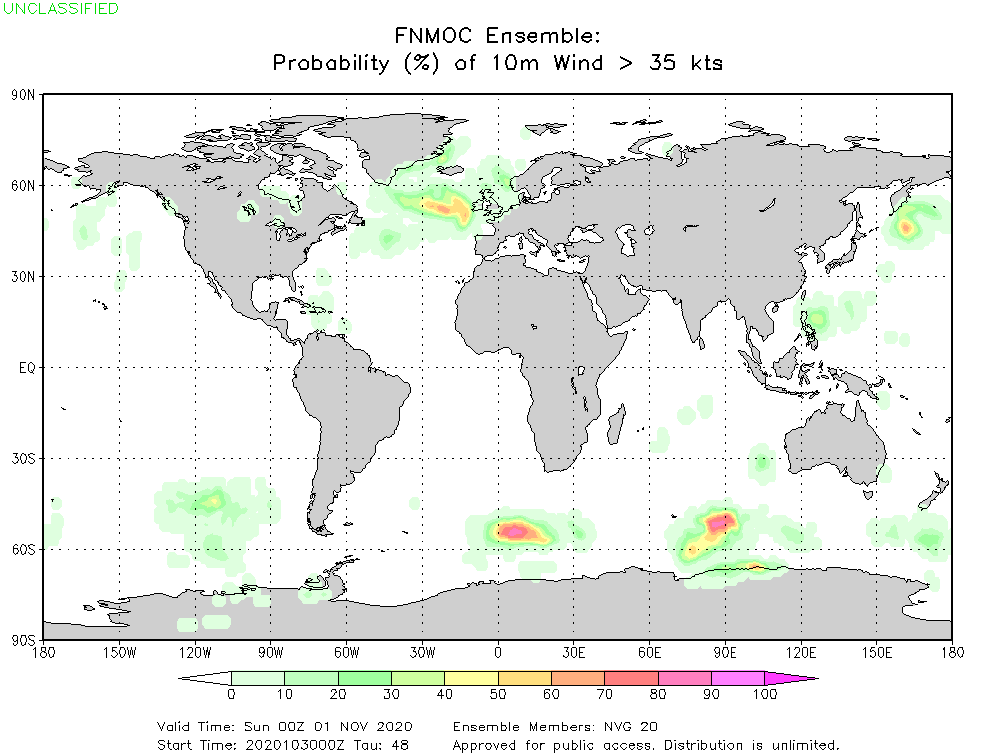
This point is illustrated by the two gale probability charts from the FNMOC NAVGEM Ensemble. The T+48 chart shows good agreement between the members in time and space whilst the T+384 shows a low probability of gales across virtually the whole Northern Hemisphere indicating disagreement in time or space, not that there will not be gale force winds.

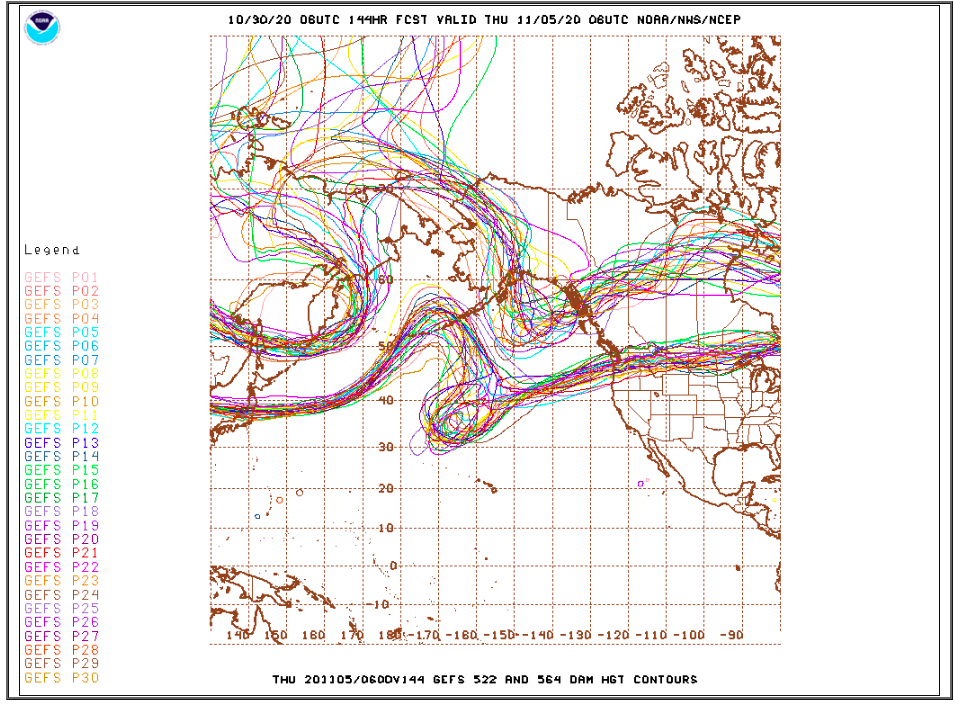
Another commonly used means of analysis is to compare the spread of the ensemble members, these are often called ‘spaghetti’ plots. Once again however, these are not straightforward to interpret as tightly bunched solutions could indicate that there is a degree of confidence or simply that there was insufficient variation in the Ensemble. The plot below shows the GEFS ensemble members 522m and 564m height contours at T+144. The northerly 522m lines indicate the limit of when rain and snow are equally likely whilst the southerly 564m lines are helpful in identifying the southern limit of force 7 or higher westerlies during the winter and force 6 westerlies during the summer. Even at 7 days, considerable geographic spread is evident in key areas.

A technique used for longer range forecasts is to group each individual ensemble member with similar ones into groups of evolution or ‘clusters’. For each cluster the ensemble member closest to the centre of the cluster is referred to as the weather scenario for that cluster. These clusters are typically combined with a set of fixed climatological regimes for each season or sub-season/region to provide a set of typical weather scenarios for daily comparison. At ECWMF for instance, there are some 20 ‘typical’ pressure patterns that are compared to the ensemble members and the ensemble members are matched to these.
The emphasis changes from fine detail forecasts to providing an indication of how the weather might change, or be different from normal seasonal or sub-seasonal values expressed in terms of anomalies. For example there is high/low confidence that it will be warmer, colder, wetter, drier, windier, etc. It is worth pointing out that even a low confidence, less precise forecast is, in itself, useful information for decision-makers.
Teleconnections
These variations in model initialisation include incorporation of global weather patterns/cycles associated with climate variability across multiple time scales, commonly referred to as teleconnections. Excuse the acronym rich text but it is worth highlighting some of these to get the flavour. These teleconnections include inter alia: El Niño–Southern Oscillation (ENSO) where we currently have a moderate to strong La Nina; the Madden-Julian Oscillation (MJO) where different phases bring different weather types to different parts of the world including more favourable conditions for tropical cyclones; the North Atlantic Oscillation (NAO); Pacific Decadal Oscillation (PDO); Artic Oscillation (AO); the strength and variations of the global monsoon systems; coherent sub-seasonal tropical variability such as atmospheric Kelvin Waves (KW), Equatorial Rossby Waves (ERW), African easterly waves. Other stratospheric conditions are included such as the Quasi-Biennial Oscillation (QBO) (strong winds in the stratosphere produced by intense tropical weather systems which reverse direction every 14 months) with links to high latitude blocking or sudden strategic warmings.
In the northern hemisphere the pattern of Arctic Sea Ice anomalies is another consideration. There are many more, but you get the picture of producing multiple ensembles and clusters to see the potential variability, patterns and cycles. For example, if the focus is on the North Atlantic basin then the most important factors are the state of the NAO, AO, Arctic sea ice, ocean temperatures (particularly the sub-polar gyre) and the QBO (an easterly/westerly QBO tends to weaken/strengthen the jetstream). For those interested, ECWMF provide a useful description on extended range influences. Use of multi-model ensembles, such as the North American Multimodel (NMME) can further improve skill over a single model ensemble, and this approach provides a valuable tool as guidance for expert operational forecasters.
Climatology
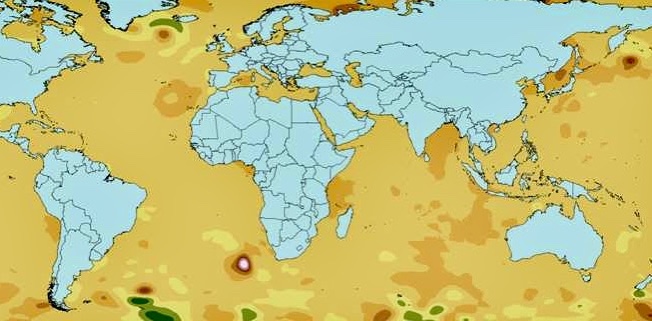
Climatology is essentially weather (meteorological and oceanographic) conditions averaged over a period of time. It is the synthesis of weather conditions, characterised by long-term statistics (mean values), standard deviations, quantiles, etc. for any given set of parameters. For example, wind and/or wave parameter variability for the Indian Ocean as seen by this graphic illustrating the probability for winds exceeding Beaufort Force 5 in the Indian Ocean for the month of January. This process can then be applied to any wind speed/location as a means to provide optimal ship routing.

Long range forecasts and ship routing
Technology advances mean that extended range forecasts are starting to show more skill than deriving information from pure climatology. Therefore optimal ship routing benefits from the combination of long range ocean wave forecasting updated daily rather than follow standard seasonal routes aligned with traditional pilot charts which depict monthly averages for prevailing winds, currents and wave heights. See Huw Davies’s earlier blog titled ” Climatology – under the hood of optimised ship routeing“, where one way forward is to combine probabilistic analysis with state of the art modelling applied to the study of climate change.
The most important parameter regarding the speed of a vessel is the surface wave action which today can be obtained from wave models for the short to medium term and derived from model wind forecasts over the extended range period. The final ingredient is ocean currents which are increasing in skill, as more remote sensing data becomes available, and where the leading models are now capable of resolving eddies. As ocean currents (away from continental shelves) change slowly over several weeks, one can make use of persistence to cover longer voyages and merge model outputs with climatology. Tidal current information is also added over continental shelves and shallow coastal waters to improve accuracy.

There are some fundamental differences between how forecasters work in the short range and the longer term. The latter requires forecasters to choose between, or combine, information from multiple models, errors tend to be related to the position and intensity of atmospheric systems rather than be systematic errors in the model/data construction, the skill of forecasts is measured against climate rather than model persistence, and statistical knowledge is more important than meteorological knowhow.
For extended range ship routing we pay particular attention to ensemble forecasts and the overall weather patterns and monthly Mean Sea Level Pressure (MSLP) charts. These are updated daily and so routes can be refined over the short to medium term as conditions may change locally. This approach represents best practice and helps provide maximum warning. More importantly, it is more cost efficient in optimising cross ocean voyages, especially for avoiding medium to longer term disruptive weather events or even exploit weather windows of opportunity that are not captured by climatology. Advances in computational capability have resulted in better automated route generation, but the hybrid human/technology combination offers the best way forward.
Stay connected and safe.