It is not unusual for June to be a quiet start to the typhoon season, but things have remained that way in early July. The historical average number of systems through to the end June is 4-5. So far this year there have only been 2. There has been a decreasing trend in the first half of the year in recent years, so this does not indicate any marked change.
Forecasting the number of typhoons in the NWP is more complex than that for the Atlantic hurricane season. The NWP region is the most active basin in the world for tropical cyclones (TCs). On average there are 26 tropical storms, of which 16 reach typhoon strength and 8 become super typhoons (equivalent to hurricane Cat 3-5 strength). Typhoon activity can occur at any time of the year with peak season lasting from May to November generally in the region and from July to October over the Philippines region. Historically some 90-95% of typhoons occur after 1 May. Overall the consensus from expert agencies is for 2020 to see less than average activity with 22-25 tropical storms, 12-14 typhoons and 6-7 super typhoons. However, the South China Sea region could be above normal, with some 11 systems and 5 expected to reach typhoon strength.
Typhoon frequency and distribution is linked to a series of large scale interconnected Indo-Pacific coupled weather and ocean phenomena:
- The Southern Oscillation Index (SOI). The Southern Oscillation Index (SOI). This is a standardized index based on the observed sea level pressure differences between Tahiti and Darwin, Australia which captures state of the Southern Oscillation occurring between the western and eastern tropical Pacific. Prolonged positive (negative) periods coincide with cold (warm) SST in the eastern tropical Pacific during La Nina (El Nino) episodes.

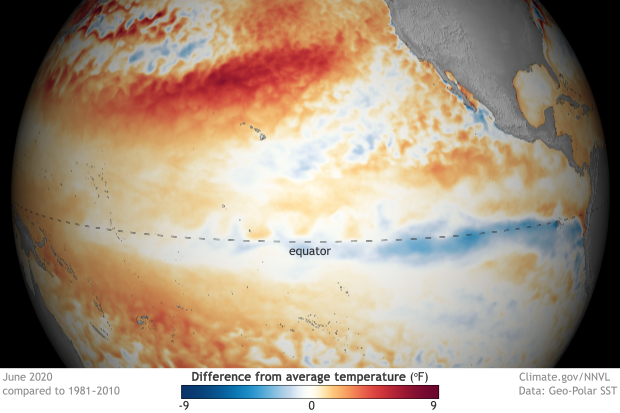
- The ENSO (El Nino Southern Oscillation) Cycle which has two phases. EL Nino events occur when sea surface temperatures (SST) are warmer in the central and eastern Pacific and are associated with a negative SOI. ENSO is currently neutral with some La Nina (cooler in the central and eastern Pacific) trend in May/June which is expected to become weak La Nina later in peak season when heading into the boreal winter. This graphic helps explain the phenomena.

Generally, El Nino years experience below average activity but greater intensity due to longer sea tracks while La Nina conditions shift the cyclogenesis region westward towards the Philippines reducing the sea track and so have above average activity with fewer intense typhoons. Cyclone paths tend to be westerly or northwesterly in El Nino years and to be more westerly and pass south of Taiwan under La Nina conditions.
- ENSO-Modoki (a more recently identified phenomena that is becoming increasingly common thought to relate to global warming) where warmer SST occur in the central Pacific flanked by cool regions to both the east and west under El Nino Modoki (above normal activity) and vice versa for La Nina Modoki with cooler SST in the central Pacific (below normal activity). Research on using this to provide better seasonal forecasts remains ongoing for now.
- The Madden-Julian Oscillation (MJO) is a tropical disturbance that propagates eastward around the global tropics with a cycle on the order of 30-60 days. The MJO is quite variable from periods of little or no activity to moderate or strong activity. Overall, the MJO tends to be most active during ENSO neutral years, and is absent during moderate to strong El Nino and La Nina events. More information on the MJO can be found here.
- Indian Ocean Dipole (IOD) which is an irregular oscillation of SST where the western IO is warmer (positive phase) or cooler (negative phase) than the eastern IO. SSTs have been 1-2 Deg C above normal in the eastern IO, so the IOD is expected to remain near neutral or weak negative but become moderate negative during the peak season and in to the boreal autumn. Above normal SSTs in the eastern IO result in a smaller temperature contrast across southeastern Asia and a weaker monsoon trough over the South China Sea. These SSTs are expected to cool to more normal levels going forward in to the Autumn, so strengthening the monsoon trough.
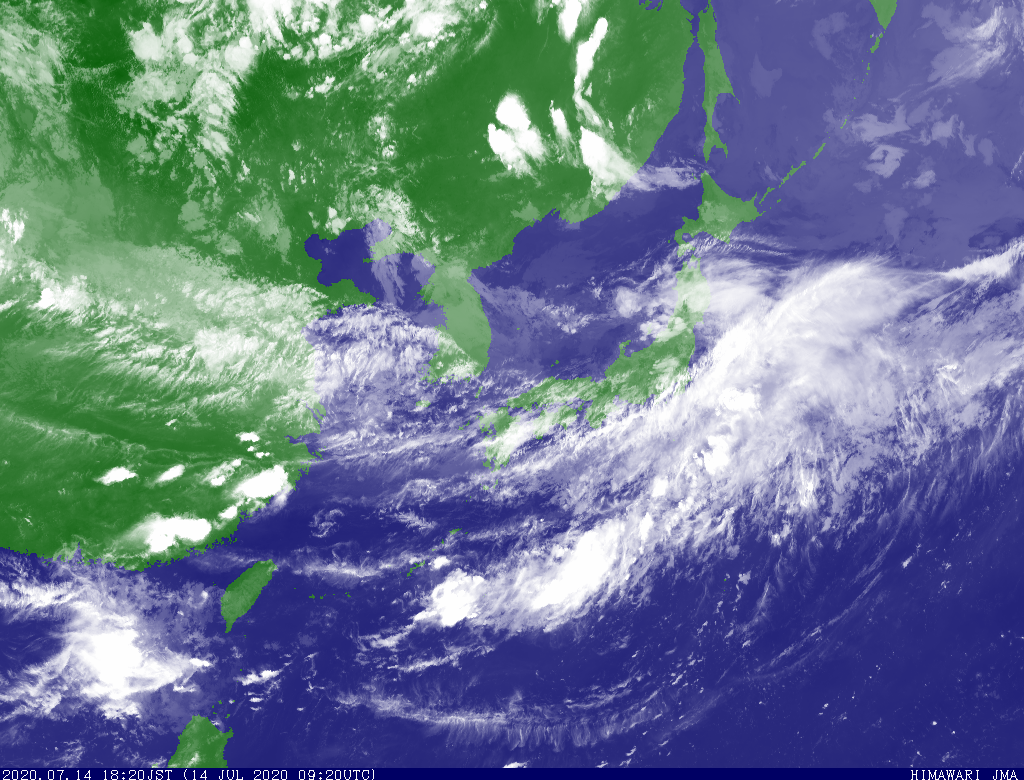
Most typhoons form along the shear zone between the monsoon westerlies and the easterly trade winds, and the stronger the monsoon trough then the more activity. The location and strength of the summer SW Monsoon Trough is a key factor in determining the variability of tropical cyclone development. As this Himawari satellite image for today shows there are plenty of cloud clusters/squalls present across the region but, as of yet, no sign of any significant TC development. The reason for this is that trade and upper level winds over the NW Pacific basin have been stronger than normal in June. Tropical Storm Risk reported 9 July that the trade wind speed measured at 925 hPA (2500 ft) for June is the third strongest on record since 1965. This increased strength has suppressed typhoon activity in a weak monsoon trough and is the reason for the eerie start to the season.
Meanwhile today, both the Joint Typhoon Warning Centre (JTWC – with INVEST 99W) and the Japanese Meteorological Agency (JMA – as a tropical depression) are monitoring an area of convection located over the northern Philippines that is moving slowly northwest in to the Luzon St/eastern South China Sea – see the Himawari IR image below for 1240 UTC today. There is a low to medium level risk of this developing further over the next few days with continuing vertical wind shear in the region and expectation that the system will be absorbed into an approaching frontal boundary (Meiyu).

Looking ahead then with peak season approaching the NW Pacific region looks set to become quite busy and more like an average season going forward if the predictions are correct in reaching 25 tropical storms. Time will tell……
About StratumFive: For more than a decade StratumFive has been delivering leading cost-effective voyage monitoring solutions and now provides services to more than 12,000 ships through its global network, which includes the FleetWeather operations centre in the USA and its 50 year history of service excellence.