Many experts, including those at Pole Star Global, predicted an above-average 2024 hurricane season for the Atlantic basin.
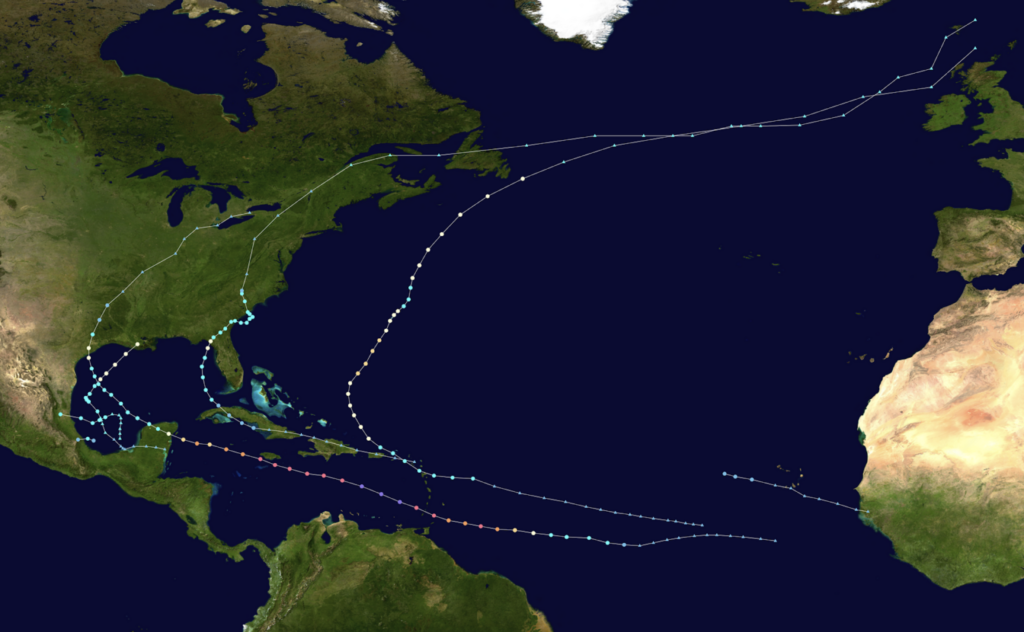
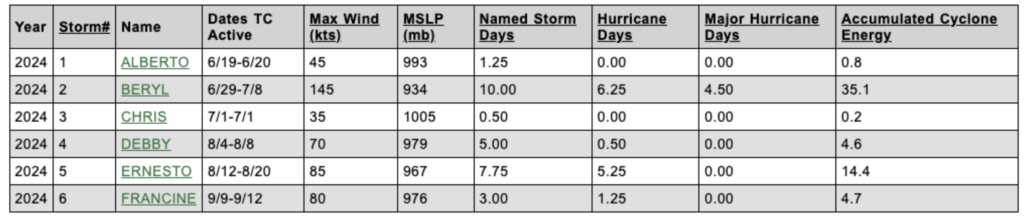
The hurricane season typically peaks around September 10th. Yet, that date has already passed, and so far, there have been only six named storms (see Figure 1), four of these storms became hurricanes. One notable example was Hurricane Beryl, which took many by surprise by strengthening into a major Category 5 hurricane in early July.
In a typical year, there are 14 named storms In the Atlantic basin. Yet, with predictions of an above-average 2024 hurricane season, experts and agencies have forecasted at least 23-24 named storms.. Half of the hurricane season remains, raising the question: will the Atlantic basin be as active as anticipated?
Why the 2024 Hurricane Season Has Been Quieter Than Predicted
Before looking ahead, it’s important to understand why the first half of the 2024 hurricane season has been relatively quiet.
Many tropical systems originate as tropical waves, or clusters of thunderstorms that move off the African continent and across the Atlantic Ocean. This is where they have the potential to develop into more organised storms.
Earlier this year, however, these tropical waves tracked farther north than usual, encountering cooler waters and dry, dusty air. These conditions deprived each thunderstorm of the moisture needed for further development.
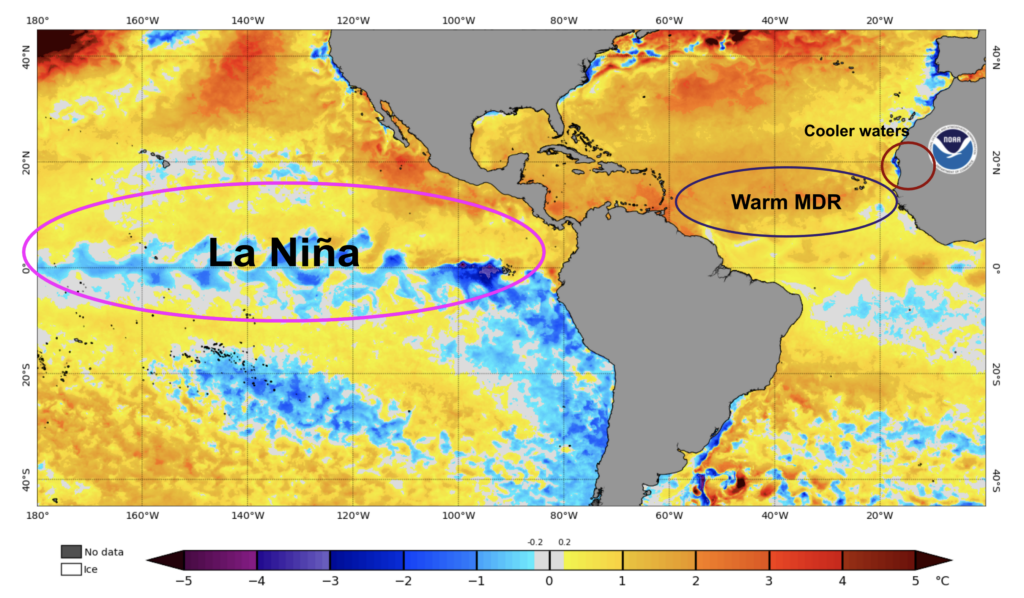
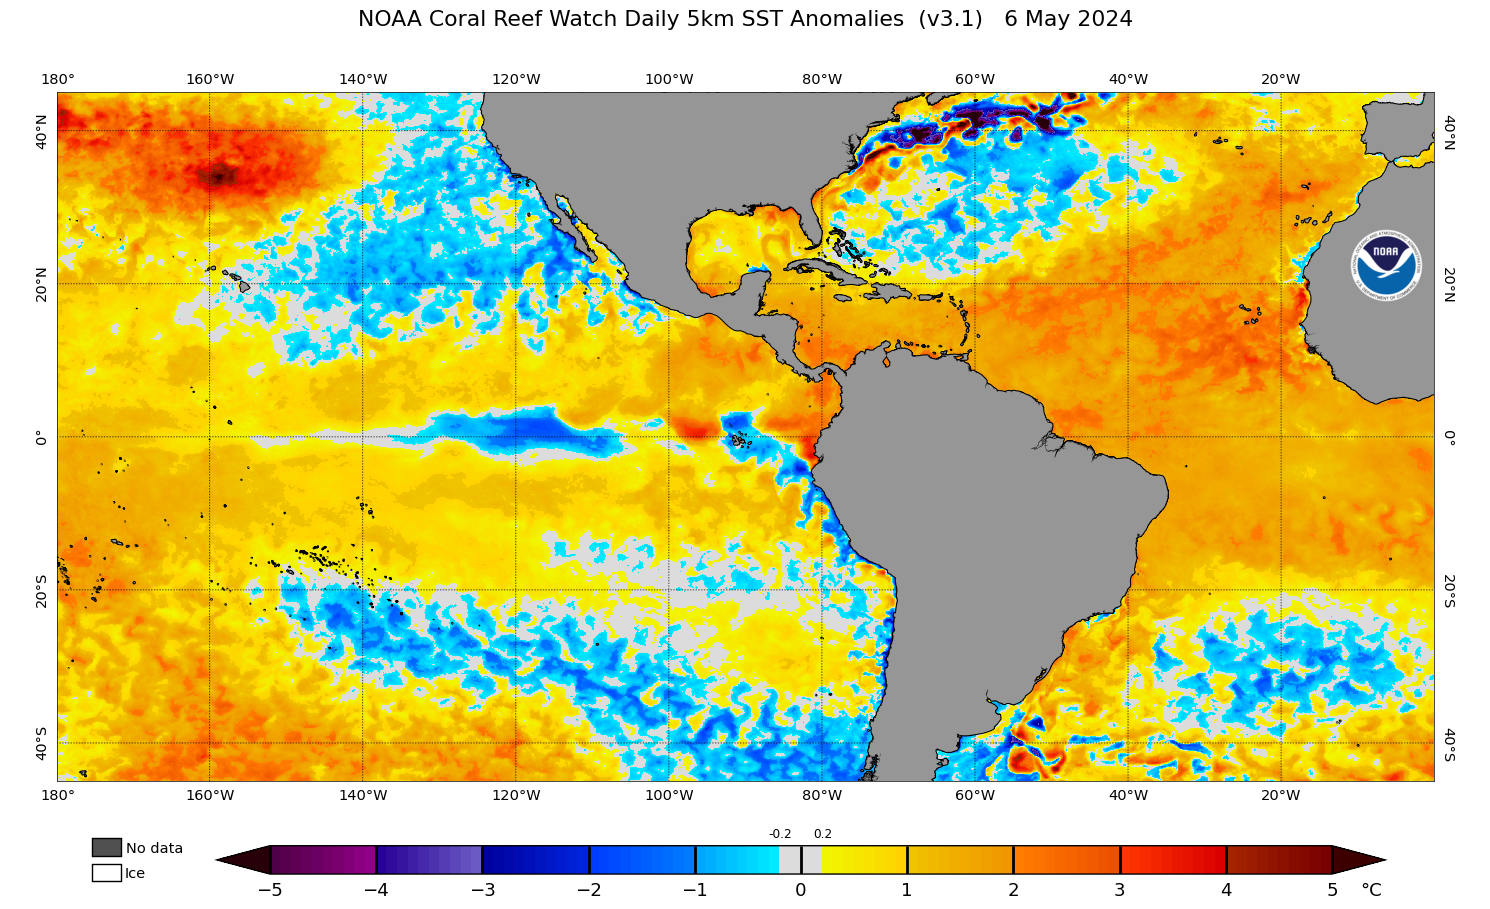
Showcasing this, refer to Figure 2. As you can see, the sea surface temperatures (SST) along the coast of Mauritania (circled in red) were lower than average. This is where the storms were moving off the African coast. These cooler waters, combined with the northward trajectory of each tropical wave made it harder for each storm to organise and strengthen. What’s more, the dry, warmer air above weakened the region’s instability.
Moving forward, this article explores the projected outlook for the remainder of the 2024 hurricane system.
The Future Outlook: Understanding the Predictions for an Above-Average 2024 Hurricane Season
As you move from the coast of Mauritania to the Atlantic basin (refer to Figure 2), note the above average sea surface temperatures (SST). This suggests that the second half of the 2024 hurricane season might be very active.That is, the main development region (MDR) is warmer than normal, and this trend is likely to continue for the remainder of the season. (The MDR is a key area in the Atlantic basin where most tropical cyclones and major hurricanes form. It is marked in Figure 2 for your reference.)
Specifically, Figure 2 shows SST anomalies from the African coast to the Cape Verde Islands are 0.0-1.0℃ above average. While in the Caribbean Sea and Gulf of Mexico, SSTs across the region are 1.0-3.0℃ above average (Figure 2). Hurricanes need SSTs of at least 26℃ to develop. These above average SSTs in the MDR region could lead to an increase in hurricane activity.
In conjunction with the above, initial forecasts predicted the onset of a La Niña event by early summer. Current observations confirm that a La Niña event is indeed in place, characterised by SSTs 0-3°C below average in the equatorial Pacific (Figure 2). La Niña conditions typically create a more favorable environment for tropical development due to reduced vertical wind shear (less changes in wind direction and speeds with height) and weaker trade winds in the Atlantic basin. Forecasts suggest that this La Niña event will continue throughout the remainder of the hurricane season, supporting further tropical activity. (Tropical activity refers to the frequency, intensity, and duration of hurricane storms in the Atlantic basin.)
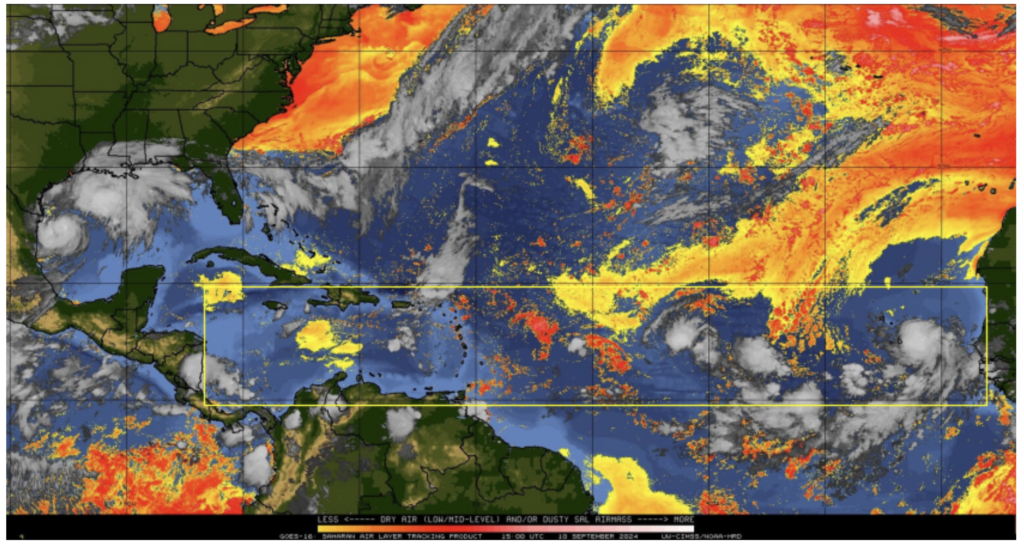
Next, consider air movement across the Atlantic basin, specifically in the MDR (refer to Figure 3, with the MDR region highlighted in yellow). The Saharan Air Layer (SAL) is at a minimum across the MDR as dry dusty air has shifted further north of this region at the time of writing. With less dry air impacting the region, there’s increased moisture availability, which is favorable for hurricane development. However, it is important to note that SAL levels can change, and if more dry air moves into MDR, it could inhibit hurricane growth.
Bringing It All Together: Forecasts for an Active Hurricane Season
Real-time North Atlantic Ocean Statistics by Storm, 2024
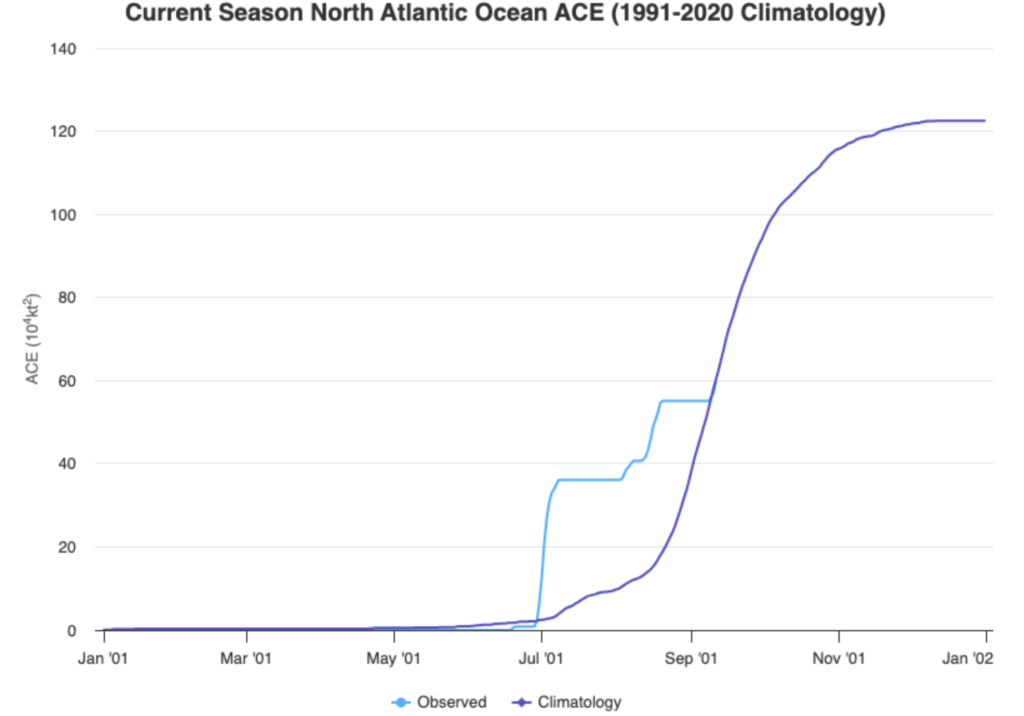
As of September 9th, the Accumulated Cyclone Energy (ACE) across the North Atlantic is estimated at 59.6 as displayed in Figure 4. ACE is a metric used to evaluate tropical activity in the basin. It takes into account the number of tropical cyclones that occur, how long they existed and how intense they became. The Climate Prediction Center states ACE values for the North Atlantic are normally 73-126. Values that exceed the normal ranges indicate a more active season which would mean more storms and/or more in the way of stronger storms that lasted longer in duration. Yet, even though the current ACE value is below average, an active hurricane season is still expected.
Hurricane Beryl set the stage pushing the North Atlantic ACE above average by early July, and given that historically there’s an exponential increase in ACE during September-November, the season remains on track to be active. The combination of elevated SSTs, a persistent La Niña, and minimal SAL conditions contributes to this outlook.
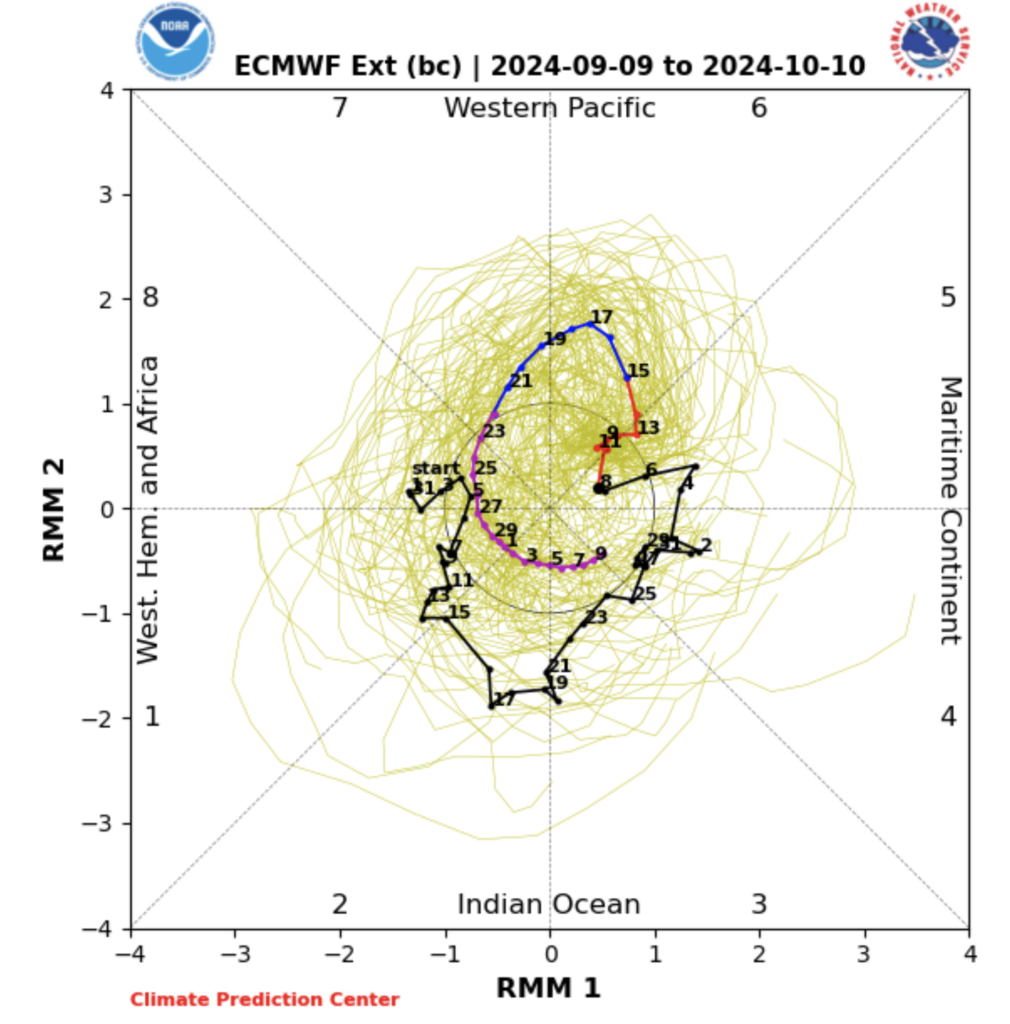
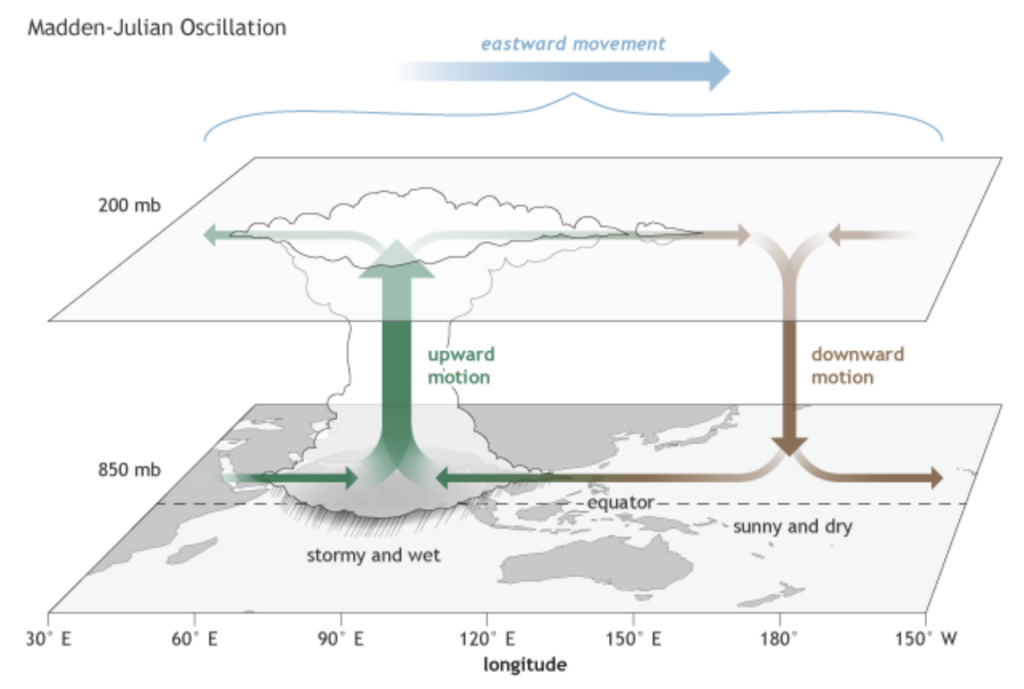
Finally, take a look at the Madden-Julian Oscillation (MJO) forecast (Figure 5). The MJO is an eastward moving disturbance of clouds, rainfall, winds, and pressure that traverses the planet in the tropics and returns to its initial starting point in 30 to 60 days, on average (see Figure 6). Currently, the MJO is in phase 5, which supports tropical activity across tropical Asia and the eastern Indian Ocean regions specifically.
The MJO is expected to move into phase 1 by late September, and then to phase 2 by early October. A study has shown that in previous years, the Atlantic ACE is highest when the MJO is moving slowly and is in Phase 1 and 2. Therefore, the position of MJO from now until early October would indicate heightened tropical activity toward the end of the season. Please refer to the above ECMWF (European Centre for Medium-Range Weather Forecasts) extended model, with most models in agreement. Also note that, despite the MJO typically weakening as it moves eastward across the eastern Pacific and into the Atlantic, conditions in the upper levels of the atmosphere are more conducive for upward motion and thus thunderstorm development (which may eventually organise into a tropical storm). See Figure 6 for reference.
Conditions Favour Increased Hurricane Activity: A Summary of What to Expect in the Coming Weeks
While the 2024 Atlantic hurricane season started with surprising intensity given Hurricane Beryl was an early season Category 5 Hurricane, and despite an average ACE index thus far, the prevailing conditions suggest that activity will likely increase as we move into peak and late season.
Warmer-than-average SSTs, minimal SAL interference, the ongoing La Niña event, create a favorable environment for hurricane development. Plus, the MJO forecast supports enhanced tropical activity in the coming weeks.
To find out more information or to speak to a member of our team, get in touch at [email protected]. Podium’s FleetWeather team, at Pole Star Global, are here to keep you connected and safe. Receive regular updates to help you navigate changing weather conditions, keeping you one step ahead at all times.