In the Atlantic Ocean, hurricane season officially begins June 01st and lasts until November 30th while reaching its peak September 10th. With this year’s season quickly approaching, we are going to look ahead and offer our analysis and predictions for the upcoming season.
Looking Back at the 2023 Season
Last year was the fourth most active season on record with 20 named storms (tied with 1933); 7 hurricanes, and 3 major hurricanes. According to the National Oceanic and Atmospheric Administration, an average hurricane season consists of 14 named storms, 7 hurricanes, and 3 major hurricanes. While actual hurricanes were right at average, total named tropical systems were above average in a big way. In fact, the National Hurricane Center (NHC) used all but two of the names on last year’s official list with only Vince and Whitney going unused.

(Fig.1) 2023 Atlantic Basin Tropical Storm Tracks Source: https://en.wikipedia.org/
Looking Ahead to the 2024 Season
Sea Surface Temperatures (SSTs)
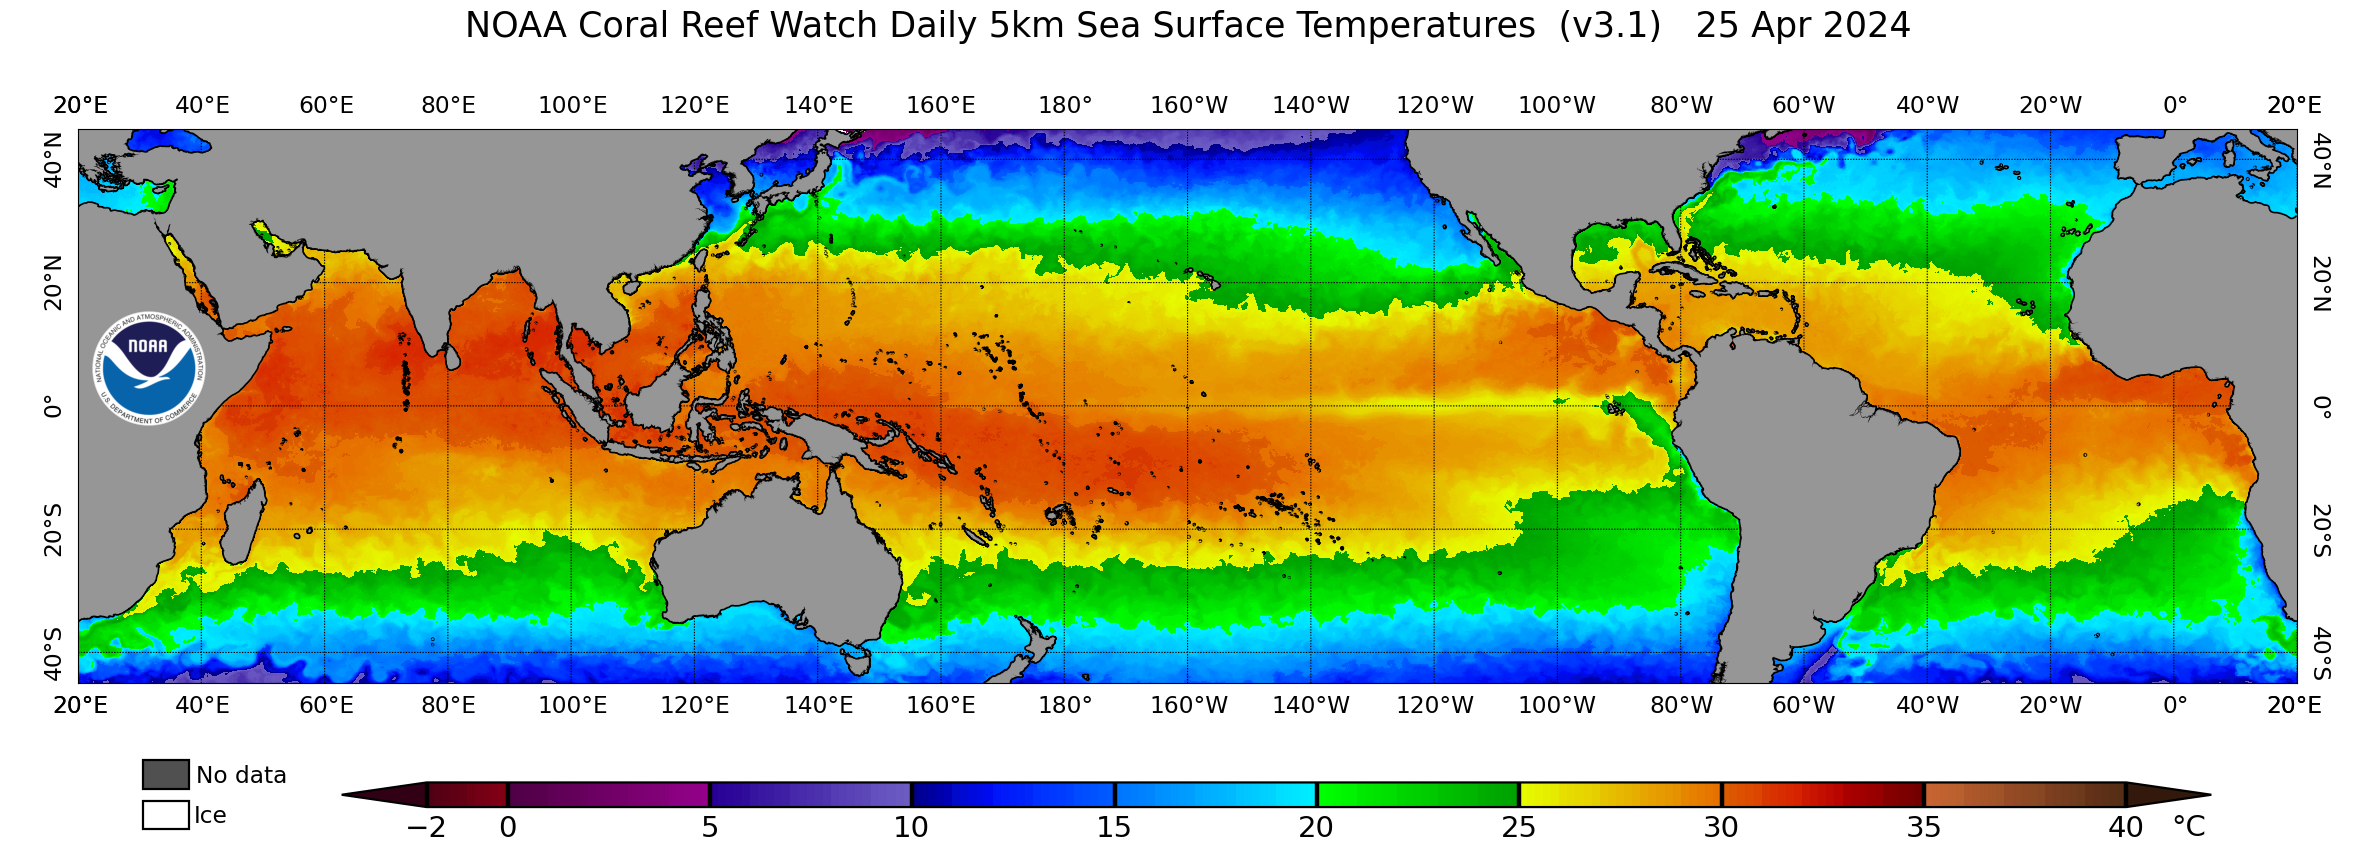
Warm waters of 26C and above are one of the main driving factors for tropical development. At the time of this writing, we are currently crossing from mid to late April 2024 and already we see SSTs well above 26C across the Main Development Region (MDR) which stretches from northwest Africa west to west-northward across the Caribbean Sea, Gulf of Mexico and Tropical North Atlantic. Please see the analysis below which is valid for Apr 19 2024.

Fig.2) NOAA Coral Reef Watch Daily 5km Sea Surface Temperatures (v3.1) 19 Apr 2024 Source: https://coralreefwatch.noaa.gov/data_current/5km/v3.1_op/daily/png/coraltemp_v3.1_tropics_current.png
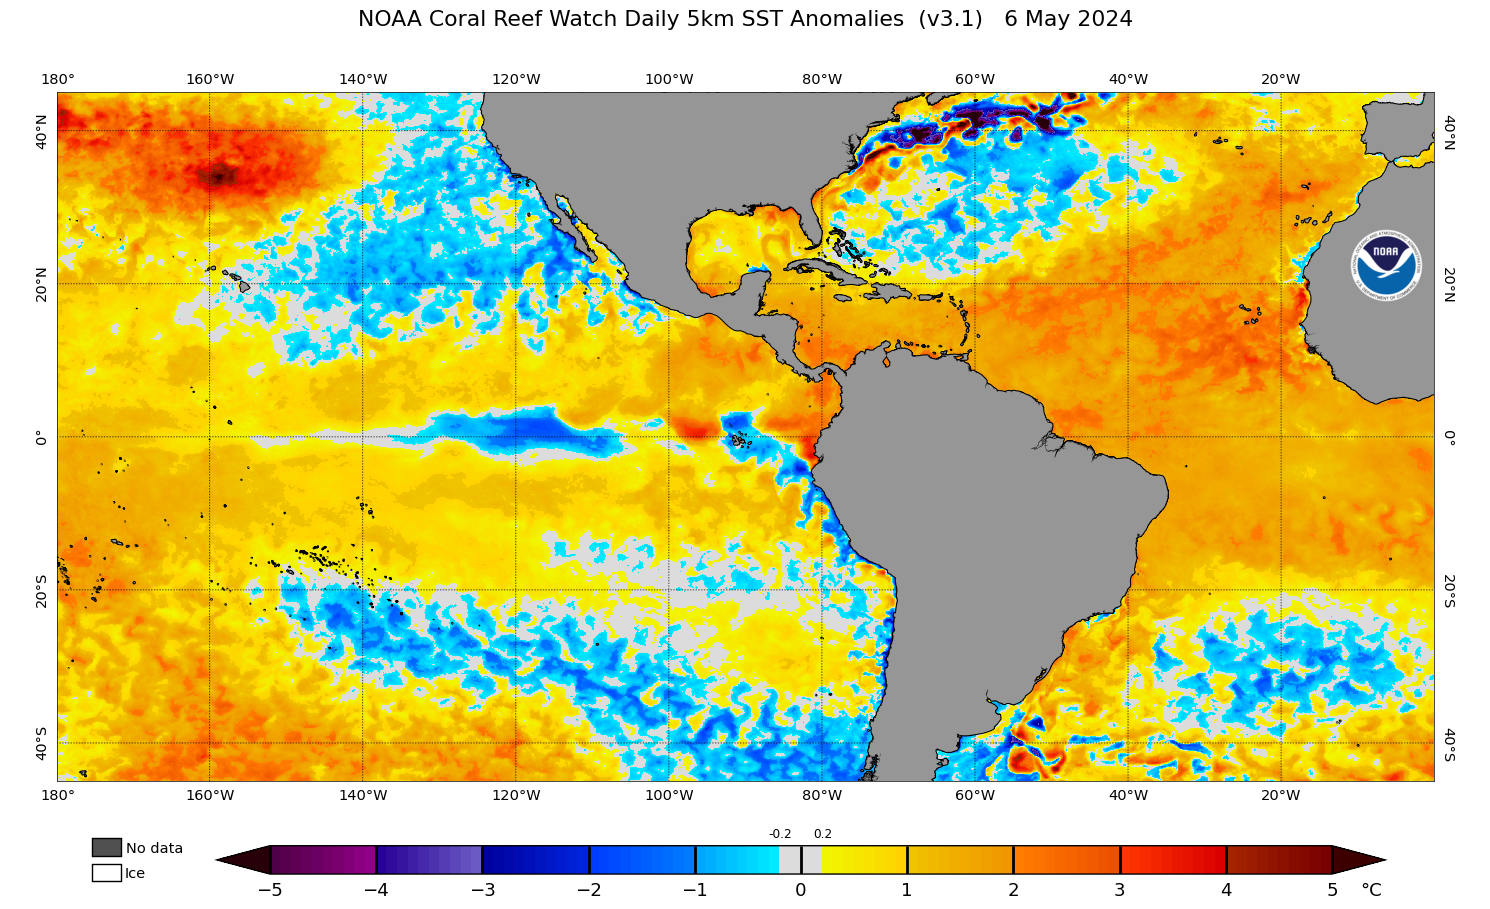
In the same vein, we like to look at SST anomalies, that is how far above or below average are the current temperatures in the region we’re concerned with? As we look at the below analysis which is also valid for Apr 20 2024, we see nearly all areas across the MDR between the Lesser Antilles and northwest coast of Africa analyzed at 1-2C above normal. In addition, there are some localized pockets of 3C above normal several hundred miles east of Barbados, off northern Brazil, and encircling the Cape Verdes Islands. This trend is likely to continue as we move closer to summer.

Fig.3) NOAA Coral Reef Watch Daily 5km SST Anomalies (v3.1) 20 Apr 2024 Source: https://coralreefwatch.noaa.gov/data_current/5km/v3.1_op/daily/png/ct5km_ssta_v3.1_west_current.png
In fact, climate models indicate that this will indeed be the case. Now while climate models certainly do not tell the entire story when it comes to seasonal tropical predictions, they can certainly be good indicators for what’s in store. So looking at the CFSv2 Sea Surface Temperature Anomaly for this coming August, we see a large pocket of waters 1-2C above normal extending from about 50W westward across the Caribbean Sea where even higher, more localized anomalies can be seen, particularly off northwest Columbia.

Fig.4) CFSv2 Sea Surface Temperature Anomaly (C) (based on 1984-2009 Model Climatology) Source: https://www.tropicaltidbits.com/
Looking ahead to November of this year (shown below), SSTs across the central tropical Atlantic are expected to still be about 0.8-1.6C above normal as we approach late autumn, marking the end of the season. Similarly higher values are seen along the Gulf Coast as well.

Fig.5) CFSv2 Sea Surface Temperature Anomaly (C) (based on 1984-2009 Model Climatology) Source: https://www.tropicaltidbits.com/
La Niña Signature
As we turn our attention to the Pacific Ocean, we’ll begin to analyze the possibility of a La Niña year and the potential impacts on North Atlantic tropics this year. In the below analysis (valid Apr 19 2024) courtesy of NOAA, we see that SSTs have begun to cool off western Peru and Ecuador.

Fig.6) NOAA/NESDIS GEO-POLAR BLENDED 5 km SST ANALYSIS FOR THE EQUATORIAL PACIFIC Source: https://www.ospo.noaa.gov/data/sst/contour/equatpac.cf.gif
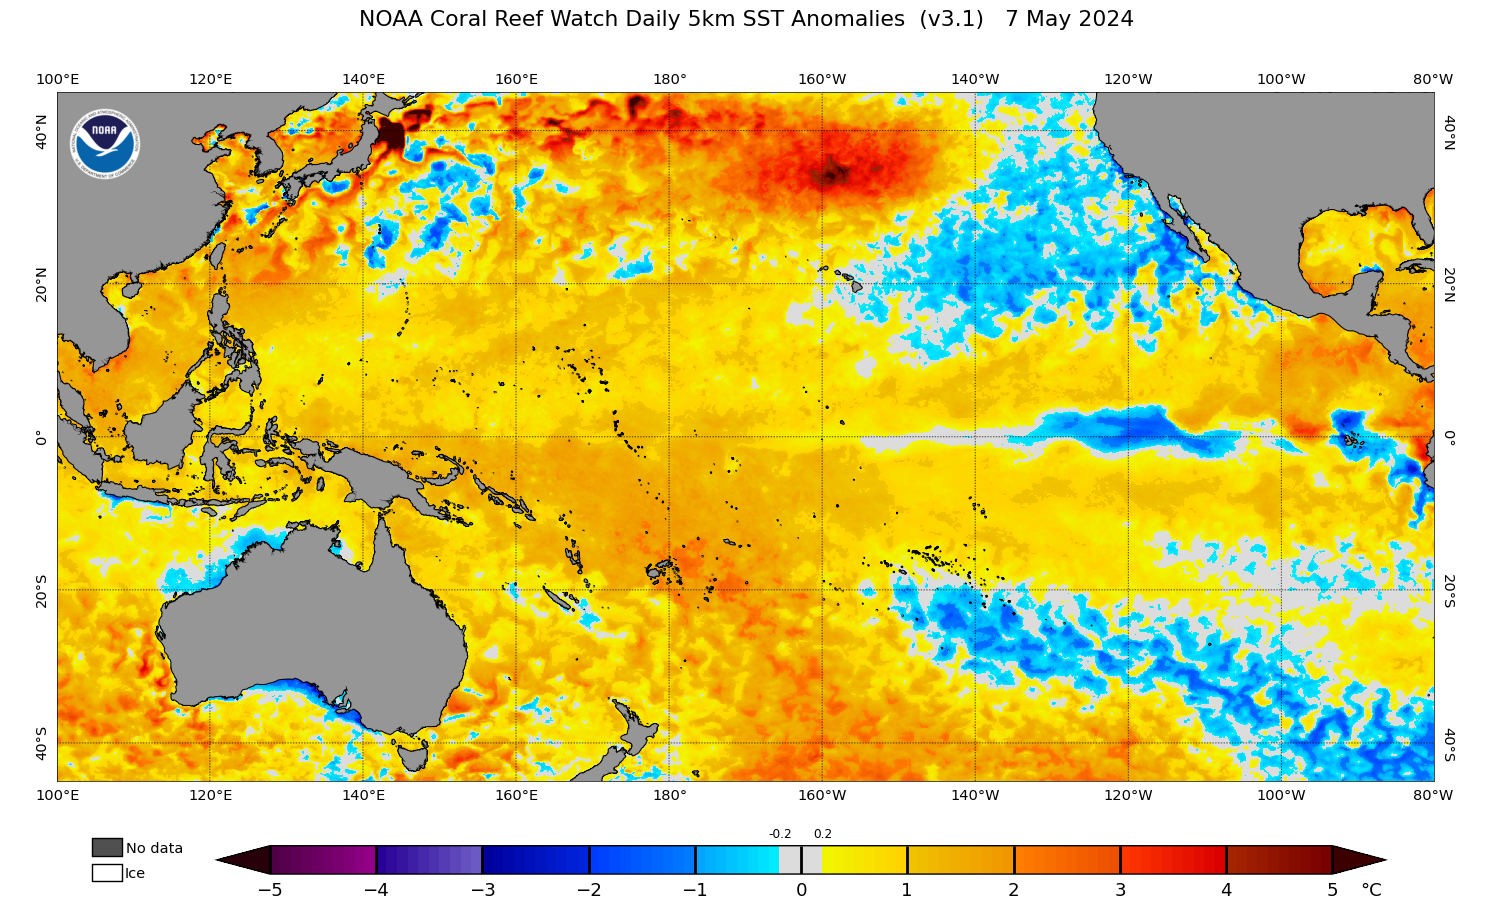
Looking at the SST Anomaly analysis (valid for April 19, 2024) below, we can actually see the beginning of a La Niña event. Notice the tongue of blue anomalies encircled in red off western Peru and Ecuador. These departures from normal by 2C-3C in the region signify the beginning of a La Niña event. Why is this significant? Well as that tongue of cooler than normal waters spreads west over the coming months across the equatorial eastern Pacific, these cooler seas have a moderating effect on the atmosphere. Especially during a significant La Niña event, this can cause upper-level westerlies to weaken which decreases vertical wind shear across the Tropical North Atlantic. The decrease in windshear then allows the atmosphere to become more buoyant, resulting in more intense thunderstorm activity.

Fig.7) Source: NOAA Coral Reef Watch Daily 5km SST Anomalies (v3.1) 19 Apr 2024 https://coralreefwatch.noaa.gov/data_current/5km/v3.1_op/daily/png/ct5km_ssta_v3.1_pacific_current.png
Total Accumulated Precipitation Anomaly
Utilizing the same model for Total Accumulated Precipitation Anomaly for August, we see a very wet MDR with much of the Caribbean Sea and Gulf of Mexico at 1-2 inches above normal and a large portion of the tropical North Atlantic at 2-4 inches above normal.

Fig.8) CFSv2 Total Accumulated Precipitation Anomaly (inches) Source: https://www.tropicaltidbits.com/
Using the same model and looking ahead to November of this year when tropics are expected to be winding down, we see even higher concentrations over Puerto Rico and the Northern Leeward Islands of 4-6 inches above normal, a localized maximum of 6-8 inches along northwest Columbia, and a region of 2-4 inches above normal located several hundred miles southwest of the Cape Verdes.

Fig.9) CFSv2 Total Accumulated Precipitation Anomaly (inches) Source: https://www.tropicaltidbits.com/
Connecting the Dots
As meteorologists, we know that the main ingredients needed for tropical development are high sea temperatures, low vertical wind shear, and high moisture content. During a typical year, sometimes one or two of these factors are present resulting in an at or below normal season. However, could all three of these factors line up for a truly above average or even exceptional season? Are there any inhibiting factors?
The Saharan Dust layer that is transported from northern Africa westward across the Atlantic by the easterly trade winds, is one of the main inhibitors of tropical development across the basin. Let’s take a look at the below image and see if we notice any preliminary trends.

Fig.10) University of Athens (AM&WFG) Dust Concentration Near Ground (ugr/m^3) Source: https://forecast.uoa.gr/en/forecast-maps/dust/north-atlantic
The above image taken April 20, 2024 at the time of this writing shows low to moderate dust levels present across the MDR with the highest concentrations located in the mid to western half of the basin. We will need to closely monitor short term trends near the start of the season as any enhancement of the tradewinds could shift the dust westward across the MDR.
We have already demonstrated that high sea surface temperatures are likely to coincide with a high precipitation anomaly. However, will these also team-up with a strong La Niña resulting in low vertical wind shear over the Atlantic and allow for these storms to actually develop? The latest climate guidance we have indicates the answer is “Yes!” Looking at the below 3-month probability of below/above normal SST analysis courtesy of Copernicus, we see that the probability of a La Niña event occurring during the peak of tropics season (July-September) is 70-100%. This indicates a moderate to strong La Niña may coincide with both higher than normal SSTs in the Tropical Atlantic as well as above average precipitation across the region.

Fig.11) C3C: CMCC contribution Prob (most likely category of forecast SST) Source: https://climate.copernicus.eu/charts/packages/c3s_seasonal/products/c3s_seasonal_spatial_cmcc_ssto_3m?area=area08&base_time=202404010000&type=tsum&valid_time=202407010000
The occurrence of a La Niña event during the tropics season is also supported by NOAA. As the below graph shows, there is a 60% chance of La Niña occurring from June through August with those chances increasing through the end of the year. In fact, the below chart indicates an over 70% chance of a La Niña during the peak of the season July-September.

Fig.12) Official NOAA CPC ENSO Probabilities (issued Apr. 2024) Source: https://www.cpc.ncep.noaa.gov/products/analysis_monitoring/enso_advisory/figure07.gif
Summary
Taking the potential coincidence of the three factors we have discussed above: abnormally warm waters across the MDR, high moisture content (inferred by high precipitation anomalies), and a moderate to strong La Niña, we turn our attention to a single metric called Accumulated Cyclone Energy (ACE). During a normal or average year, the ACE index is typically 66-103.
For this year as cited from Colorado State’s Tropical Outlook, the ACE value for the Atlantic Basin this year is 210. As ACE is used to describe the combined potential number of storms, their duration and intensity, and the number of tropical storms and hurricanes, this number of 210 implies that sufficient energy is present in the atmosphere for a large number of tropical storms with an above average percentage of those storms being either intense, long-lived, or both.
In conclusion, a high ACE value of 210 and the likelihood of a La Niña event, we predict an above average Atlantic Hurricane season for 2024 with 24 named storms, 8 hurricanes, and 5 major hurricanes. As it stands at the time of this writing, we see very little reason not to be bullish on this upcoming season as we see very few, if any inhibiting factors and a fairly good chance of several favorable factors coinciding to produce a very active year.
ABOUT THE AUTHOR
By Aaron Burton
Aaron Burton is from Bogota, NJ and is currently residing in Poughkeepsie, NY. Aaron has a Bachelor’s Degree in Earth Science - Meteorology, has been with Fleetweather since October 2006, and has 15+ years of experience in marine forecasting and optimum ship routing. He is an Registered Meteorologist (RMeT) and Fellow of the Royal Meteorological Society (FRMeTS) and is currently a Senior Marine Router on the Pacific Sharks watch.

Leverage FleetWeather's services on the Podium5 Voyage Informatics Platform, integrating fleet monitoring, regulatory compliance, performance analytics, and voyage optimization into one flexible solution. Visit podium5.com for more information.


